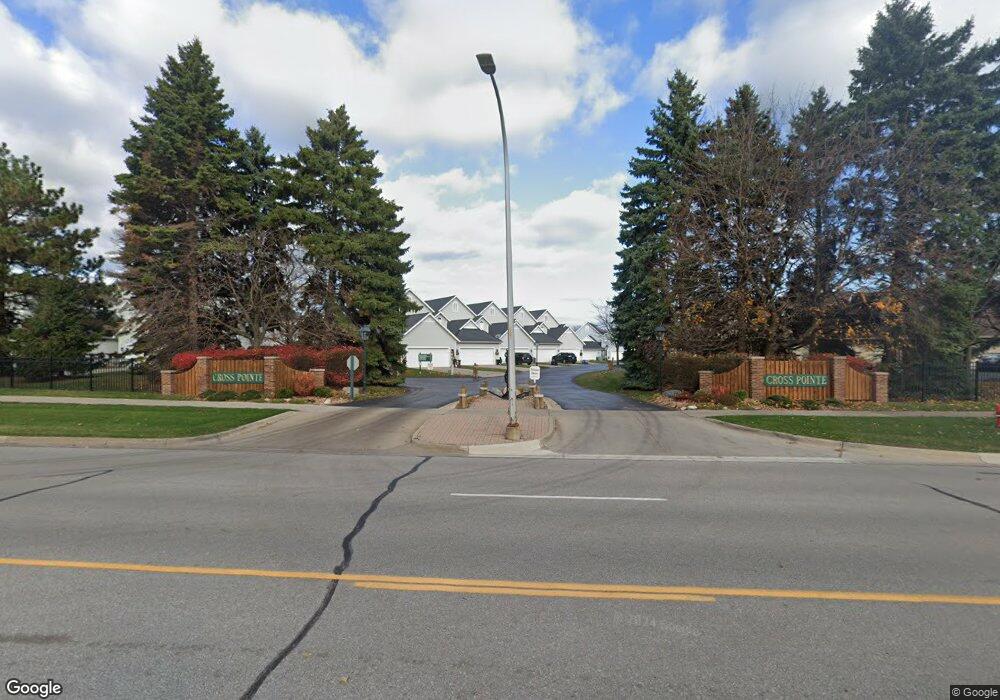
741 Cross Pointe Dr Unit Building D Unit RD-2 Port Huron, MI 48060
Estimated Value: $321,000 - $361,000
2
Beds
4
Baths
1,824
Sq Ft
$189/Sq Ft
Est. Value
About This Home
This home is located at 741 Cross Pointe Dr Unit Building D Unit RD-2, Port Huron, MI 48060 and is currently estimated at $344,327, approximately $188 per square foot. 741 Cross Pointe Dr Unit Building D Unit RD-2 is a home located in St. Clair County with nearby schools including Woodrow Wilson Elementary School, Holland Woods Middle School, and Port Huron High School.
Ownership History
Date
Name
Owned For
Owner Type
Purchase Details
Closed on
Oct 27, 2021
Sold by
Dickinson Craig A and Dickinson Lorrie A
Bought by
Wilson William and Wilson Cheryl
Current Estimated Value
Home Financials for this Owner
Home Financials are based on the most recent Mortgage that was taken out on this home.
Original Mortgage
$110,000
Outstanding Balance
$100,459
Interest Rate
3.05%
Mortgage Type
New Conventional
Estimated Equity
$243,868
Purchase Details
Closed on
Mar 16, 2021
Sold by
Semco Energy Ventures Inc
Bought by
Cross Pointe Condominium Co-Owners Assoc
Purchase Details
Closed on
Oct 23, 2019
Sold by
King and Donna
Bought by
Dickinson Craig A and Dickinson Lorrie A
Create a Home Valuation Report for This Property
The Home Valuation Report is an in-depth analysis detailing your home's value as well as a comparison with similar homes in the area
Home Values in the Area
Average Home Value in this Area
Purchase History
| Date | Buyer | Sale Price | Title Company |
|---|---|---|---|
| Wilson William | $252,000 | Liberty Title | |
| Cross Pointe Condominium Co-Owners Assoc | -- | None Listed On Document | |
| Dickinson Craig A | $223,000 | Ata National Title Group |
Source: Public Records
Mortgage History
| Date | Status | Borrower | Loan Amount |
|---|---|---|---|
| Open | Wilson William | $110,000 |
Source: Public Records
Tax History Compared to Growth
Tax History
| Year | Tax Paid | Tax Assessment Tax Assessment Total Assessment is a certain percentage of the fair market value that is determined by local assessors to be the total taxable value of land and additions on the property. | Land | Improvement |
|---|---|---|---|---|
| 2025 | $5,167 | $122,200 | $0 | $0 |
| 2024 | $4,579 | $113,100 | $0 | $0 |
| 2023 | $4,327 | $105,300 | $0 | $0 |
| 2022 | $4,491 | $105,200 | $0 | $0 |
| 2021 | $5,031 | $109,100 | $0 | $0 |
| 2020 | $5,334 | $113,300 | $113,300 | $0 |
| 2019 | $3,552 | $91,200 | $0 | $0 |
| 2018 | $3,472 | $91,200 | $0 | $0 |
| 2017 | $3,111 | $81,300 | $0 | $0 |
| 2016 | $2,698 | $81,300 | $0 | $0 |
| 2015 | $2,690 | $71,100 | $71,100 | $0 |
| 2014 | $2,690 | $71,100 | $71,100 | $0 |
| 2013 | -- | $71,100 | $0 | $0 |
Source: Public Records
Map
Nearby Homes
- 741 Cross Pointe Dr
- 743 Cross Pointe Dr
- 739 Cross Pointe Dr
- 749 Cross Pointe Dr
- 737 Cross Pointe Dr
- 735 Cross Pointe Dr
- 735 Cross Pointe Dr Unit RD-24, building
- 823 E Pointe
- 745 Pointe Dr
- 747 Pointe Dr Unit RF30
- 747 Pointe Dr Unit F, 20
- 747 Pointe Dr Unit F, RF-30
- 747 Pointe Dr Unit DRIVE
- 749 Pointe Dr
- 749 Pointe Dr Unit RF29
- 821 E Pointe Unit RG33
- 821 E Pointe Unit RG33/G
- 819 E Pointe
- 751 Pointe Dr
- 817 E Pointe