Estimated Value: $245,000 - $272,000
3
Beds
2
Baths
1,249
Sq Ft
$212/Sq Ft
Est. Value
About This Home
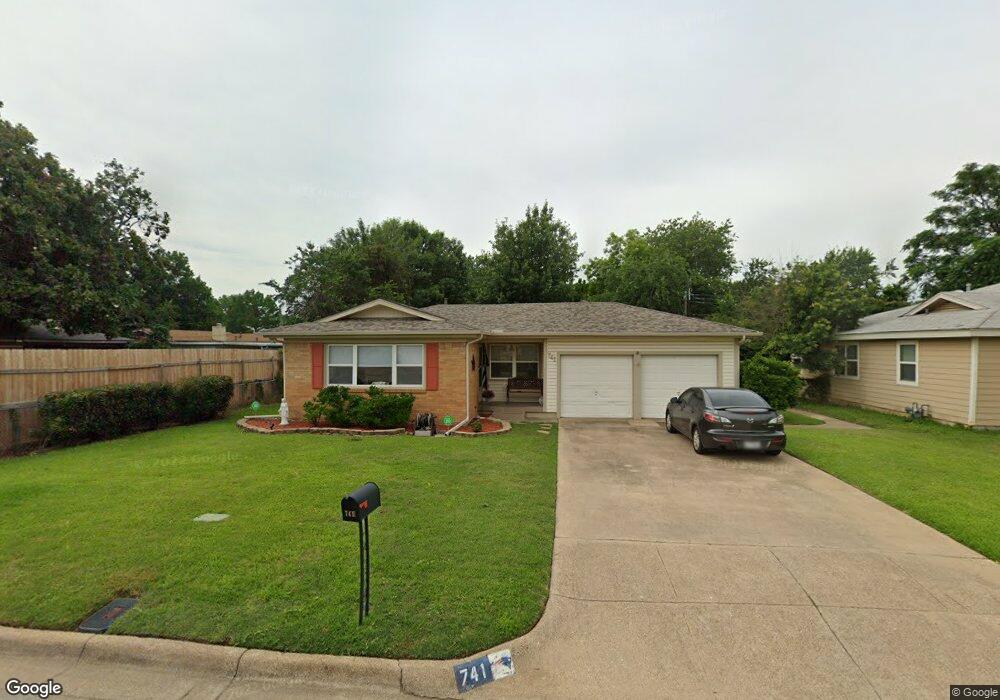
This home is located at 741 Cullum Ave, Hurst, TX 76053 and is currently estimated at $264,910, approximately $212 per square foot. 741 Cullum Ave is a home located in Tarrant County with nearby schools including West Hurst Elementary School, Hurst J High School, and L.D. Bell High School.
Ownership History
Date
Name
Owned For
Owner Type
Purchase Details
Closed on
Oct 22, 2001
Sold by
Huff Tood D and Huff Anna J
Bought by
Quinn Maureen K
Current Estimated Value
Home Financials for this Owner
Home Financials are based on the most recent Mortgage that was taken out on this home.
Original Mortgage
$87,309
Outstanding Balance
$34,051
Interest Rate
6.84%
Estimated Equity
$230,859
Purchase Details
Closed on
Jul 29, 1996
Sold by
Boggess Charles D
Bought by
Huff Todd D and Huff Anna J
Home Financials for this Owner
Home Financials are based on the most recent Mortgage that was taken out on this home.
Original Mortgage
$70,194
Interest Rate
8.32%
Mortgage Type
FHA
Purchase Details
Closed on
Mar 7, 1996
Sold by
Shields Wayne Franklin and Shields Nona Frances
Bought by
Boggess Charles D
Home Financials for this Owner
Home Financials are based on the most recent Mortgage that was taken out on this home.
Original Mortgage
$30,000
Interest Rate
7.38%
Create a Home Valuation Report for This Property
The Home Valuation Report is an in-depth analysis detailing your home's value as well as a comparison with similar homes in the area
Home Values in the Area
Average Home Value in this Area
Purchase History
| Date | Buyer | Sale Price | Title Company |
|---|---|---|---|
| Quinn Maureen K | -- | Allegiance Title Co | |
| Huff Todd D | -- | American Title Company | |
| Boggess Charles D | -- | First American Title Co |
Source: Public Records
Mortgage History
| Date | Status | Borrower | Loan Amount |
|---|---|---|---|
| Open | Quinn Maureen K | $87,309 | |
| Previous Owner | Huff Todd D | $70,194 | |
| Previous Owner | Boggess Charles D | $30,000 |
Source: Public Records
Tax History
| Year | Tax Paid | Tax Assessment Tax Assessment Total Assessment is a certain percentage of the fair market value that is determined by local assessors to be the total taxable value of land and additions on the property. | Land | Improvement |
|---|---|---|---|---|
| 2025 | $3,183 | $263,045 | $60,000 | $203,045 |
| 2024 | $3,183 | $263,045 | $60,000 | $203,045 |
| 2023 | $4,140 | $262,046 | $30,000 | $232,046 |
| 2022 | $4,325 | $217,509 | $30,000 | $187,509 |
| 2021 | $4,119 | $197,299 | $30,000 | $167,299 |
| 2020 | $3,735 | $164,329 | $30,000 | $134,329 |
| 2019 | $3,454 | $169,602 | $30,000 | $139,602 |
| 2018 | $2,610 | $128,308 | $18,000 | $110,308 |
| 2017 | $2,952 | $148,382 | $18,000 | $130,382 |
| 2016 | $2,683 | $131,473 | $18,000 | $113,473 |
| 2015 | $2,136 | $96,400 | $12,000 | $84,400 |
| 2014 | $2,136 | $96,400 | $12,000 | $84,400 |
Source: Public Records
Map
Nearby Homes
- 780 Betty Ln
- 637 Post Oak Dr
- 800 Treadwell Ct Unit 800B
- 808 Betty Ct
- 408 Simmons Dr
- 416 Simmons Dr
- 608 W Redbud Dr
- 852 W Redbud Dr
- 758 Briarwood Ln
- 756 Briarwood Ln
- 712 Pine St
- 3216 Fountain Pkwy
- 709 Hurstview Dr
- 512 Billie Ruth Ln
- 8729 Lake Meadows Ln
- 528 Buena Vista Dr
- 8736 Trinity Vista Trail
- 540 Billie Ruth Ln
- 420 Twin Creek Dr
- 47 Donald Ct
Your Personal Tour Guide
Ask me questions while you tour the home.