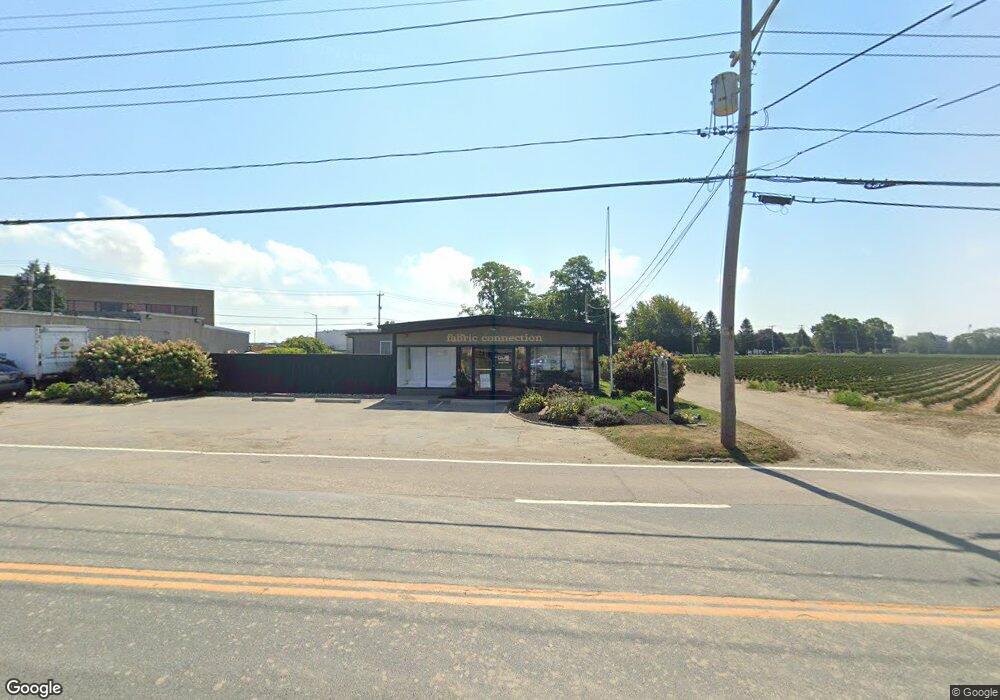
741 E Main Rd Middletown, RI 02842
Estimated Value: $1,223,351
Studio
--
Bath
3,588
Sq Ft
$341/Sq Ft
Est. Value
About This Home
This home is located at 741 E Main Rd, Middletown, RI 02842 and is currently estimated at $1,223,351, approximately $340 per square foot. 741 E Main Rd is a home located in Newport County with nearby schools including Middletown High School, All Saints STEAM Academy, and The Pennfield School.
Ownership History
Date
Name
Owned For
Owner Type
Purchase Details
Closed on
May 14, 2013
Sold by
Highlander Realty Llc
Bought by
Go Design Llc
Current Estimated Value
Home Financials for this Owner
Home Financials are based on the most recent Mortgage that was taken out on this home.
Original Mortgage
$367,500
Outstanding Balance
$260,039
Interest Rate
3.6%
Mortgage Type
Commercial
Estimated Equity
$963,312
Purchase Details
Closed on
May 21, 2009
Sold by
Shinko Llc
Bought by
Highlander Realty Llc
Create a Home Valuation Report for This Property
The Home Valuation Report is an in-depth analysis detailing your home's value as well as a comparison with similar homes in the area
Home Values in the Area
Average Home Value in this Area
Purchase History
| Date | Buyer | Sale Price | Title Company |
|---|---|---|---|
| Go Design Llc | $490,000 | -- | |
| Highlander Realty Llc | $520,000 | -- |
Source: Public Records
Mortgage History
| Date | Status | Borrower | Loan Amount |
|---|---|---|---|
| Open | Highlander Realty Llc | $367,500 |
Source: Public Records
Tax History
| Year | Tax Paid | Tax Assessment Tax Assessment Total Assessment is a certain percentage of the fair market value that is determined by local assessors to be the total taxable value of land and additions on the property. | Land | Improvement |
|---|---|---|---|---|
| 2025 | $6,785 | $499,300 | $270,000 | $229,300 |
| 2024 | $6,481 | $499,300 | $270,000 | $229,300 |
| 2023 | $7,149 | $382,300 | $161,300 | $221,000 |
| 2022 | $6,824 | $382,300 | $161,300 | $221,000 |
| 2021 | $6,587 | $382,300 | $161,300 | $221,000 |
| 2020 | $6,818 | $374,400 | $156,900 | $217,500 |
| 2018 | $6,814 | $374,400 | $156,900 | $217,500 |
| 2016 | $7,117 | $348,200 | $153,900 | $194,300 |
| 2015 | $6,950 | $348,200 | $153,900 | $194,300 |
| 2014 | $8,619 | $403,900 | $184,700 | $219,200 |
| 2013 | $8,429 | $403,900 | $184,700 | $219,200 |
Source: Public Records
Map
Nearby Homes
- 836 Forest Park
- 533 Forest Park
- 662 Forest Park
- 743 Forest Park
- 502 Forest Rd
- 16 Ward Ave
- 481 Oliphant Ln
- 223 Corey Ln
- 318 Mitchell's Ln
- 74 Valley Rd
- 310 Corey Ln
- 126 Mitchells Ln
- 81 Beagle Dr
- 10 Smithfield Dr
- 23 Indian Hill Cir
- 11 Barton Ln
- 476 Green End Ave
- 136 Corporate Place
- 35 Squantum Dr
- 362 Bramans Ln
Your Personal Tour Guide
Ask me questions while you tour the home.