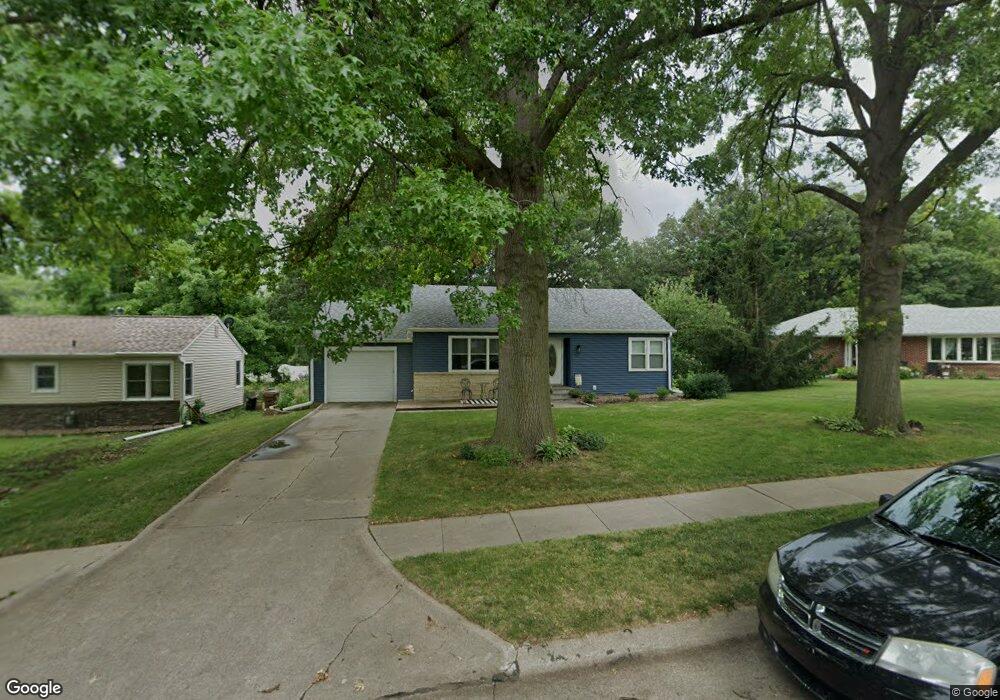
741 N 3rd St Seward, NE 68434
Estimated Value: $253,000 - $283,000
Studio
1
Bath
1,516
Sq Ft
$176/Sq Ft
Est. Value
About This Home
This home is located at 741 N 3rd St, Seward, NE 68434 and is currently estimated at $266,729, approximately $175 per square foot. 741 N 3rd St is a home located in Seward County with nearby schools including Seward Elementary School, Seward Middle School, and Seward High School.
Ownership History
Date
Name
Owned For
Owner Type
Purchase Details
Closed on
Jun 6, 2025
Sold by
Deeter Christopher L and Deeter Tamra R
Bought by
Kenow Terrance and Kenow Kayla
Current Estimated Value
Home Financials for this Owner
Home Financials are based on the most recent Mortgage that was taken out on this home.
Original Mortgage
$225,250
Outstanding Balance
$224,666
Interest Rate
6.76%
Mortgage Type
New Conventional
Estimated Equity
$42,063
Create a Home Valuation Report for This Property
The Home Valuation Report is an in-depth analysis detailing your home's value as well as a comparison with similar homes in the area
Home Values in the Area
Average Home Value in this Area
Purchase History
| Date | Buyer | Sale Price | Title Company |
|---|---|---|---|
| Kenow Terrance | $265,000 | Home Services Title |
Source: Public Records
Mortgage History
| Date | Status | Borrower | Loan Amount |
|---|---|---|---|
| Open | Kenow Terrance | $225,250 |
Source: Public Records
Tax History
| Year | Tax Paid | Tax Assessment Tax Assessment Total Assessment is a certain percentage of the fair market value that is determined by local assessors to be the total taxable value of land and additions on the property. | Land | Improvement |
|---|---|---|---|---|
| 2025 | $2,582 | $240,074 | $25,248 | $214,826 |
| 2024 | $2,532 | $221,639 | $22,925 | $198,714 |
| 2023 | $2,937 | $201,947 | $22,925 | $179,022 |
| 2022 | $2,910 | $180,802 | $22,925 | $157,877 |
| 2021 | $2,666 | $163,887 | $22,925 | $140,962 |
| 2020 | $2,700 | $163,887 | $22,925 | $140,962 |
| 2019 | $2,563 | $157,243 | $22,912 | $134,331 |
| 2018 | $2,452 | $152,055 | $21,290 | $130,765 |
| 2017 | $2,385 | $160,968 | $20,300 | $140,668 |
| 2016 | $2,259 | $139,153 | $20,276 | $118,877 |
| 2015 | $2,295 | $139,153 | $20,276 | $118,877 |
| 2013 | $2,428 | $130,984 | $16,330 | $114,654 |
Source: Public Records
Map
Nearby Homes
Your Personal Tour Guide
Ask me questions while you tour the home.