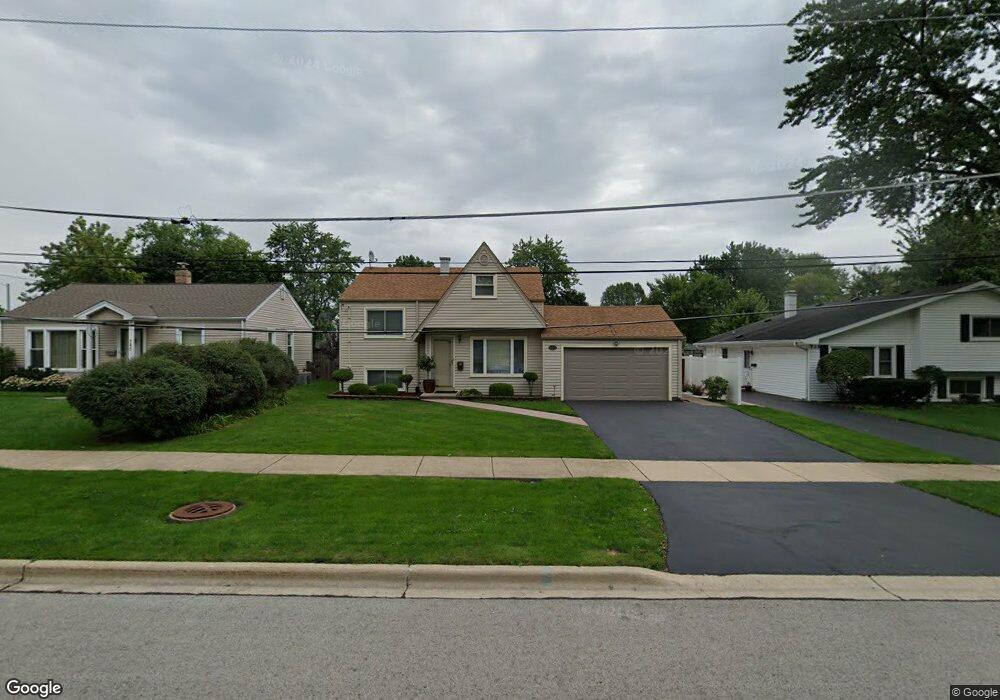
741 N Elizabeth St Lombard, IL 60148
North Lombard NeighborhoodEstimated Value: $343,687 - $380,000
--
Bed
--
Bath
1,127
Sq Ft
$317/Sq Ft
Est. Value
About This Home
This home is located at 741 N Elizabeth St, Lombard, IL 60148 and is currently estimated at $357,172, approximately $316 per square foot. 741 N Elizabeth St is a home located in DuPage County with nearby schools including Park View Elementary School, Pleasant Lane Elementary School, and Madison Elementary School.
Ownership History
Date
Name
Owned For
Owner Type
Purchase Details
Closed on
Jun 21, 2002
Sold by
Ahern David J and Ahern Magda
Bought by
Matulis Renata
Current Estimated Value
Home Financials for this Owner
Home Financials are based on the most recent Mortgage that was taken out on this home.
Original Mortgage
$171,000
Outstanding Balance
$72,354
Interest Rate
6.82%
Estimated Equity
$284,818
Purchase Details
Closed on
Jun 15, 2000
Sold by
Foley Michael J and Foley Therese A
Bought by
Ahern David J and Ahern Madga
Home Financials for this Owner
Home Financials are based on the most recent Mortgage that was taken out on this home.
Original Mortgage
$146,728
Interest Rate
8.64%
Mortgage Type
FHA
Purchase Details
Closed on
Oct 26, 1993
Sold by
Estate Of Joseph Williard Thomlinson
Bought by
Foley Michael J and Foley Therese A
Purchase Details
Closed on
Oct 25, 1993
Sold by
St Paul Federal Bank For Svgs
Bought by
Estate Of Joseph Willard Thomlinson
Create a Home Valuation Report for This Property
The Home Valuation Report is an in-depth analysis detailing your home's value as well as a comparison with similar homes in the area
Home Values in the Area
Average Home Value in this Area
Purchase History
| Date | Buyer | Sale Price | Title Company |
|---|---|---|---|
| Matulis Renata | $190,000 | First American Title | |
| Ahern David J | $159,500 | -- | |
| Foley Michael J | $109,000 | Attorneys Natl Title Network | |
| Estate Of Joseph Willard Thomlinson | $16,000 | Attorneys Natl Title Network |
Source: Public Records
Mortgage History
| Date | Status | Borrower | Loan Amount |
|---|---|---|---|
| Open | Matulis Renata | $171,000 | |
| Previous Owner | Ahern David J | $146,728 |
Source: Public Records
Tax History Compared to Growth
Tax History
| Year | Tax Paid | Tax Assessment Tax Assessment Total Assessment is a certain percentage of the fair market value that is determined by local assessors to be the total taxable value of land and additions on the property. | Land | Improvement |
|---|---|---|---|---|
| 2024 | $7,557 | $105,263 | $27,727 | $77,536 |
| 2023 | $7,184 | $97,340 | $25,640 | $71,700 |
| 2022 | $6,988 | $93,570 | $24,650 | $68,920 |
| 2021 | $6,769 | $91,250 | $24,040 | $67,210 |
| 2020 | $6,625 | $89,250 | $23,510 | $65,740 |
| 2019 | $6,291 | $84,850 | $22,350 | $62,500 |
| 2018 | $5,851 | $76,490 | $20,150 | $56,340 |
| 2017 | $5,806 | $74,360 | $24,960 | $49,400 |
| 2016 | $5,642 | $70,050 | $23,510 | $46,540 |
| 2015 | $5,324 | $65,260 | $21,900 | $43,360 |
| 2014 | $5,102 | $61,140 | $27,270 | $33,870 |
| 2013 | $5,026 | $62,000 | $27,650 | $34,350 |
Source: Public Records
Map
Nearby Homes
- 147 W North Ave
- 333 W Goebel Dr
- 306 W Sunset Ave
- 140 W Sunset Ave
- 124 W Sunset Ave
- 333 W Potomac Ave
- 201 W Potomac Ave
- 229 W Berkshire Ave
- 546 N Main St
- 201 W Crystal Ave
- 21W065 Sunset Ave
- 600 W Pleasant Ln Unit A2
- 506 N Garfield St
- 22 N Columbine Ave
- LOT 2 Armitage Ave
- LOT 9 Armitage Ave
- 231 E Berkshire Ave
- 230 Troy Ln
- 737 (LOT#21) Lawler Ave
- 260 N Charlotte St
- 745 N Elizabeth St
- 751 N Elizabeth St
- 735 N Elizabeth St
- 233 W North Ave
- 729 N Elizabeth St
- 740 N Elizabeth St
- 744 N Elizabeth St
- 736 N Elizabeth St
- 750 N Elizabeth St
- 681 N Elizabeth St
- 227 W North Ave
- 730 N Elizabeth St
- 680 N Elizabeth St
- 677 N Elizabeth St
- 676 N Elizabeth St
- 311 W North Ave
- 217 W North Ave
- 671 N Elizabeth St
- 670 N Elizabeth St
- 313 W North Ave