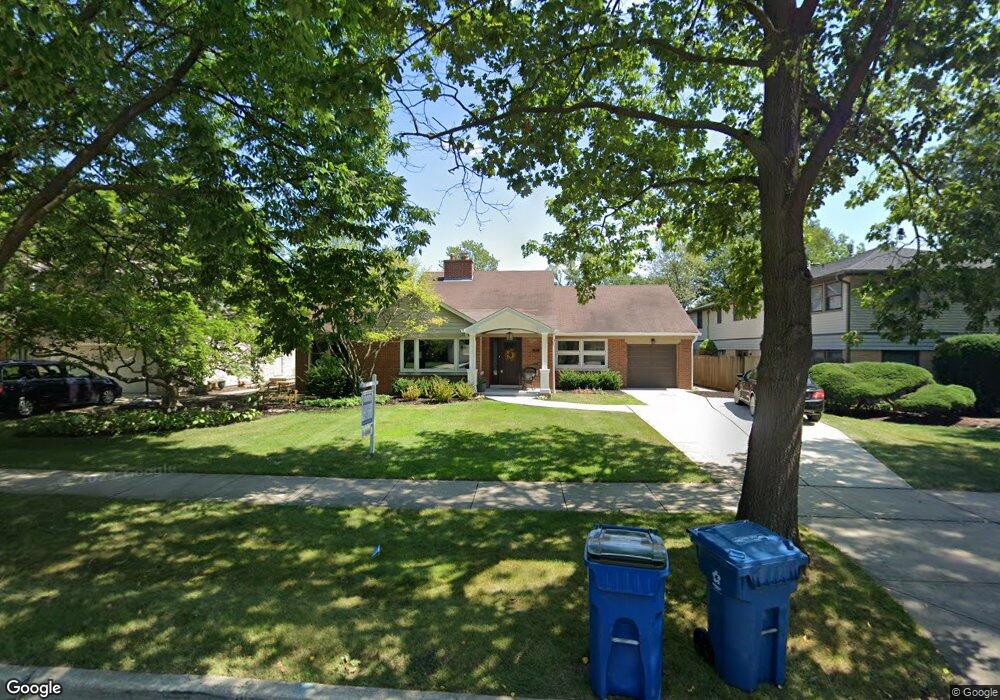
741 S Spring Ave La Grange, IL 60525
Estimated Value: $530,162 - $624,000
3
Beds
2
Baths
1,522
Sq Ft
$389/Sq Ft
Est. Value
About This Home
This home is located at 741 S Spring Ave, La Grange, IL 60525 and is currently estimated at $591,541, approximately $388 per square foot. 741 S Spring Ave is a home located in Cook County with nearby schools including Spring Avenue Elementary School, William F. Gurrie Middle School, and Lyons Township High School.
Ownership History
Date
Name
Owned For
Owner Type
Purchase Details
Closed on
Sep 24, 2018
Sold by
Foley Sean M and Porter Sara L
Bought by
Enriquez Jennifer E Holt and Enriquez Antonio P
Current Estimated Value
Home Financials for this Owner
Home Financials are based on the most recent Mortgage that was taken out on this home.
Original Mortgage
$399,200
Outstanding Balance
$345,241
Interest Rate
4.5%
Mortgage Type
New Conventional
Estimated Equity
$246,300
Purchase Details
Closed on
Sep 12, 2017
Sold by
Foley Sean M and Porter Sara L
Bought by
Foley Sean M and Porter Sara L
Purchase Details
Closed on
Apr 30, 2014
Sold by
Mcquaid Edward L
Bought by
Foley Sean M and Porter Sara L
Home Financials for this Owner
Home Financials are based on the most recent Mortgage that was taken out on this home.
Original Mortgage
$372,000
Interest Rate
4.41%
Mortgage Type
New Conventional
Purchase Details
Closed on
May 22, 2003
Sold by
Mcquaid Edward L and Mcquaid Barbara L
Bought by
Mcquaid Barbara L and Barbara L Mcquaid Trust
Create a Home Valuation Report for This Property
The Home Valuation Report is an in-depth analysis detailing your home's value as well as a comparison with similar homes in the area
Home Values in the Area
Average Home Value in this Area
Purchase History
| Date | Buyer | Sale Price | Title Company |
|---|---|---|---|
| Enriquez Jennifer E Holt | $499,000 | Greater Illinois Title | |
| Foley Sean M | -- | Attorney | |
| Foley Sean M | $465,000 | Chicago Title Insurance Co | |
| Mcquaid Barbara L | -- | Chicago Title Insurance Co | |
| Mcquaid Barbara L | -- | Chicago Title Insurance Co |
Source: Public Records
Mortgage History
| Date | Status | Borrower | Loan Amount |
|---|---|---|---|
| Open | Enriquez Jennifer E Holt | $399,200 | |
| Previous Owner | Foley Sean M | $372,000 |
Source: Public Records
Tax History
| Year | Tax Paid | Tax Assessment Tax Assessment Total Assessment is a certain percentage of the fair market value that is determined by local assessors to be the total taxable value of land and additions on the property. | Land | Improvement |
|---|---|---|---|---|
| 2025 | $4,450 | $20,142 | $3,291 | $16,851 |
| 2024 | $4,450 | $20,142 | $3,291 | $16,851 |
| 2023 | $4,099 | $20,142 | $3,291 | $16,851 |
| 2022 | $4,099 | $15,965 | $2,869 | $13,096 |
| 2021 | $3,944 | $15,964 | $2,868 | $13,096 |
| 2020 | $4,169 | $15,964 | $2,868 | $13,096 |
| 2019 | $3,931 | $14,912 | $2,615 | $12,297 |
| 2018 | $3,525 | $14,912 | $2,615 | $12,297 |
| 2017 | $4,031 | $17,285 | $2,615 | $14,670 |
| 2016 | $3,102 | $11,346 | $2,278 | $9,068 |
| 2015 | $3,057 | $11,346 | $2,278 | $9,068 |
| 2014 | $2,996 | $11,346 | $2,278 | $9,068 |
| 2013 | $3,499 | $13,650 | $2,278 | $11,372 |
Source: Public Records
Map
Nearby Homes
- 711 S Catherine Ave
- 740 S Ashland Ave
- 926 S Spring Ave
- 843 S Brainard Ave
- 822 S La Grange Rd
- 936 S Stone Ave
- 830 S La Grange Rd
- 509 S Brainard Ave
- 645 S 6th Ave
- 1036 S Ashland Ave
- 5301 S Catherine Ave
- 413 S Kensington Ave
- 434 Lagrange Rd
- 600 8th Ave
- 625 9th Ave
- 730 S 10th Ave
- 524 9th Ave
- 5348 6th Ave
- 225 S Stone Ave
- 347 S 8th Ave
- 741 S Spring Ave
- 737 S Spring Ave
- 745 S Spring Ave
- 729 S Spring Ave
- 740 S Kensington Ave
- 736 S Kensington Ave
- 744 S Kensington Ave
- 730 S Kensington Ave
- 740 S Spring Ave
- 730 S Spring Ave
- 801 S Spring Ave
- 727 S Spring Ave
- 727 S Spring Ave
- 744 S Spring Ave
- 724 S Kensington Ave
- 728 S Spring Ave
- 805 S Spring Ave
- 724 S Spring Ave
- 717 S Spring Ave
- 720 S Kensington Ave
Your Personal Tour Guide
Ask me questions while you tour the home.