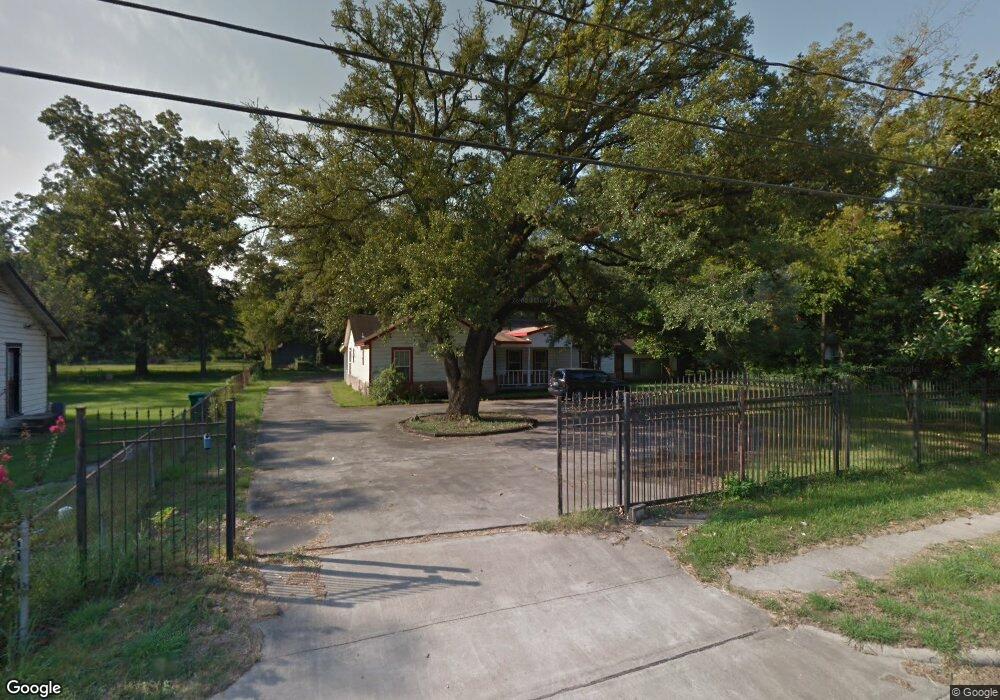
7410 Ley Rd Houston, TX 77028
Trinity-Houston Gardens NeighborhoodEstimated Value: $182,000 - $313,000
3
Beds
3
Baths
2,354
Sq Ft
$113/Sq Ft
Est. Value
About This Home
This home is located at 7410 Ley Rd, Houston, TX 77028 and is currently estimated at $266,501, approximately $113 per square foot. 7410 Ley Rd is a home located in Harris County with nearby schools including McGowen Elementary School, Key Middle, and Kashmere High School.
Ownership History
Date
Name
Owned For
Owner Type
Purchase Details
Closed on
Dec 10, 2015
Sold by
Associates Financial Services Company In
Bought by
Yancy Akbar Muhammad and Yancy Akbar Ursula
Current Estimated Value
Purchase Details
Closed on
Nov 9, 2015
Sold by
Akbar Ursula Vancy and Akbar Vancy Ursula
Bought by
Akbar Muhammad Rasul
Purchase Details
Closed on
May 8, 1995
Sold by
Schero Joe E and Simon Ester
Bought by
Akbar Mohammad
Purchase Details
Closed on
Feb 2, 1995
Sold by
Shadowens Troy Earl
Bought by
Akbar Muhammad R
Purchase Details
Closed on
May 5, 1994
Sold by
Payton Kathy R Flanagan
Bought by
Yancy Akbar Muhammad and Yancy Akbar Ursula
Home Financials for this Owner
Home Financials are based on the most recent Mortgage that was taken out on this home.
Original Mortgage
$32,500
Interest Rate
7.76%
Mortgage Type
Seller Take Back
Create a Home Valuation Report for This Property
The Home Valuation Report is an in-depth analysis detailing your home's value as well as a comparison with similar homes in the area
Home Values in the Area
Average Home Value in this Area
Purchase History
| Date | Buyer | Sale Price | Title Company |
|---|---|---|---|
| Yancy Akbar Muhammad | -- | American Title Company | |
| Akbar Muhammad Rasul | -- | American Title Comapny | |
| Akbar Mohammad | -- | Texas American Title Company | |
| Akbar Muhammad R | -- | -- | |
| Yancy Akbar Muhammad | -- | -- |
Source: Public Records
Mortgage History
| Date | Status | Borrower | Loan Amount |
|---|---|---|---|
| Previous Owner | Yancy Akbar Muhammad | $32,500 |
Source: Public Records
Tax History Compared to Growth
Tax History
| Year | Tax Paid | Tax Assessment Tax Assessment Total Assessment is a certain percentage of the fair market value that is determined by local assessors to be the total taxable value of land and additions on the property. | Land | Improvement |
|---|---|---|---|---|
| 2025 | $2,581 | $319,904 | $106,356 | $213,548 |
| 2024 | $2,581 | $254,131 | $93,062 | $161,069 |
| 2023 | $2,581 | $234,055 | $93,062 | $140,993 |
| 2022 | $2,912 | $192,633 | $66,473 | $126,160 |
| 2021 | $2,802 | $139,507 | $66,473 | $73,034 |
| 2020 | $2,647 | $122,508 | $66,473 | $56,035 |
| 2019 | $2,514 | $99,355 | $46,531 | $52,824 |
| 2018 | $2,117 | $99,355 | $46,531 | $52,824 |
| 2017 | $2,512 | $99,355 | $46,531 | $52,824 |
| 2016 | $2,354 | $93,102 | $46,531 | $46,571 |
| 2015 | $1,745 | $93,102 | $46,531 | $46,571 |
| 2014 | $1,745 | $93,102 | $46,531 | $46,571 |
Source: Public Records
Map
Nearby Homes