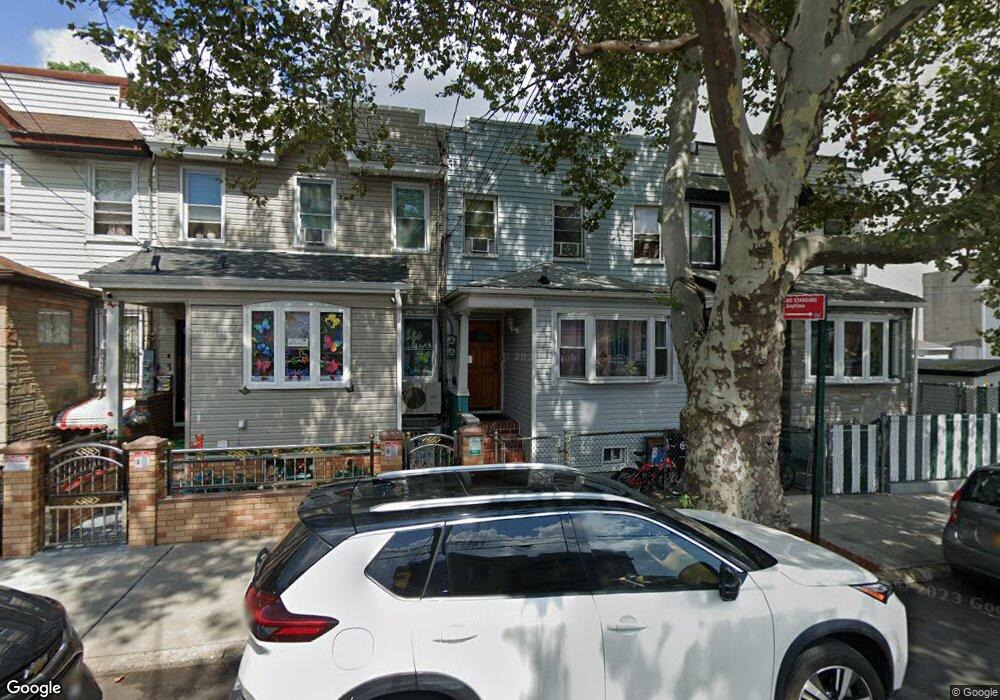
7411 97th Ave Ozone Park, NY 11416
Ozone Park NeighborhoodEstimated Value: $675,000 - $767,000
Studio
--
Bath
1,212
Sq Ft
$603/Sq Ft
Est. Value
About This Home
This home is located at 7411 97th Ave, Ozone Park, NY 11416 and is currently estimated at $730,892, approximately $603 per square foot. 7411 97th Ave is a home located in Queens County with nearby schools including P.S. 64 - Joseph P. Addabbo, Jhs 210 Elizabeth Blackwell, and Cypress Hills Ascend Charter Lower School.
Ownership History
Date
Name
Owned For
Owner Type
Purchase Details
Closed on
Dec 13, 2021
Sold by
Islam Fakrun N and Islam Mohammed R
Bought by
Islam Mohammed R
Current Estimated Value
Purchase Details
Closed on
Aug 13, 2010
Sold by
Tamatha Smith Executrix and The Estate Of James Gallagher
Bought by
Islam Mohammed R and Nahar Fakrun
Home Financials for this Owner
Home Financials are based on the most recent Mortgage that was taken out on this home.
Original Mortgage
$232,000
Outstanding Balance
$151,661
Interest Rate
4.63%
Mortgage Type
Purchase Money Mortgage
Estimated Equity
$579,231
Purchase Details
Closed on
Nov 17, 2005
Sold by
Gallagher James C and Pacho Paola
Bought by
Gallagher James C and Gallagher Sean
Purchase Details
Closed on
Feb 26, 2003
Sold by
Gallagher James C and Gallagher Pamela
Bought by
Gallagher James C and Pachon Paola
Create a Home Valuation Report for This Property
The Home Valuation Report is an in-depth analysis detailing your home's value as well as a comparison with similar homes in the area
Home Values in the Area
Average Home Value in this Area
Purchase History
| Date | Buyer | Sale Price | Title Company |
|---|---|---|---|
| Islam Mohammed R | -- | -- | |
| Islam Mohammed R | -- | -- | |
| Islam Mohammed R | -- | -- | |
| Islam Mohammed R | $290,000 | -- | |
| Islam Mohammed R | $290,000 | -- | |
| Gallagher James C | -- | -- | |
| Gallagher James C | -- | -- | |
| Gallagher James C | -- | -- | |
| Gallagher James C | -- | -- |
Source: Public Records
Mortgage History
| Date | Status | Borrower | Loan Amount |
|---|---|---|---|
| Open | Islam Mohammed R | $232,000 | |
| Closed | Islam Mohammed R | $232,000 | |
| Closed | Gallagher James C | $0 |
Source: Public Records
Tax History
| Year | Tax Paid | Tax Assessment Tax Assessment Total Assessment is a certain percentage of the fair market value that is determined by local assessors to be the total taxable value of land and additions on the property. | Land | Improvement |
|---|---|---|---|---|
| 2025 | $4,479 | $25,124 | $9,075 | $16,049 |
| 2024 | $4,491 | $23,702 | $10,266 | $13,436 |
| 2023 | $4,210 | $22,361 | $8,238 | $14,123 |
| 2022 | $3,924 | $37,620 | $15,540 | $22,080 |
| 2021 | $4,144 | $36,780 | $15,540 | $21,240 |
| 2020 | $4,136 | $35,340 | $15,540 | $19,800 |
| 2019 | $3,839 | $31,800 | $15,540 | $16,260 |
| 2018 | $3,501 | $18,634 | $12,005 | $6,629 |
| 2017 | $3,284 | $17,580 | $15,540 | $2,040 |
| 2016 | $3,828 | $17,580 | $15,540 | $2,040 |
| 2015 | $2,285 | $19,588 | $15,247 | $4,341 |
| 2014 | $2,285 | $18,480 | $17,280 | $1,200 |
Source: Public Records
Map
Nearby Homes
- 74-11-74-97 97th Ave Unit 1
- 74-11 97th Ave
- 7409 97th Ave
- 7413 97th Ave
- 74-13A 97th Ave
- 7407 97th Ave
- 7407 97th Ave Unit 2
- 7407 97th Ave
- 9536 75th St
- 95-36 75th St
- 7413A 97th Ave
- 7405 97th Ave
- 7405 97th Ave
- 9534 75th St
- 9534 75th St
- 75-01 97th Ave
- 7403 97th Ave
- 9532 75th St
- 9530 75th St
- 75-13 97th Ave