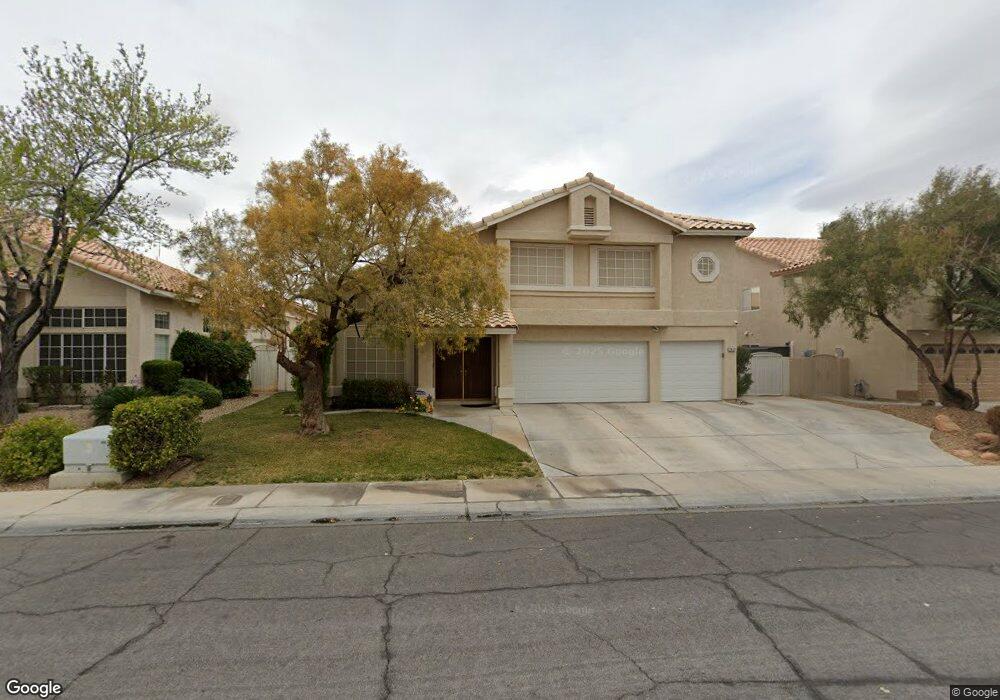
7412 Alcove Glen Ct Las Vegas, NV 89129
Lone Mountain NeighborhoodEstimated Value: $592,000 - $633,000
4
Beds
3
Baths
2,896
Sq Ft
$210/Sq Ft
Est. Value
About This Home
This home is located at 7412 Alcove Glen Ct, Las Vegas, NV 89129 and is currently estimated at $607,874, approximately $209 per square foot. 7412 Alcove Glen Ct is a home located in Clark County with nearby schools including Ruthe Deskin Elementary School, Justice Myron E Leavitt Middle School, and Centennial High School.
Ownership History
Date
Name
Owned For
Owner Type
Purchase Details
Closed on
Aug 12, 2019
Sold by
Kruse Lynn Suzanne and Kruse Stephen P
Bought by
Lokenvitz Carl H and Lokenvitz Lisa R
Current Estimated Value
Home Financials for this Owner
Home Financials are based on the most recent Mortgage that was taken out on this home.
Original Mortgage
$393,300
Outstanding Balance
$344,670
Interest Rate
3.73%
Mortgage Type
New Conventional
Estimated Equity
$263,204
Purchase Details
Closed on
Aug 29, 2001
Sold by
Zmijewski S
Bought by
Kruse Stephen P and Kruse Lynn Suzanne
Home Financials for this Owner
Home Financials are based on the most recent Mortgage that was taken out on this home.
Original Mortgage
$204,750
Interest Rate
7.09%
Create a Home Valuation Report for This Property
The Home Valuation Report is an in-depth analysis detailing your home's value as well as a comparison with similar homes in the area
Home Values in the Area
Average Home Value in this Area
Purchase History
| Date | Buyer | Sale Price | Title Company |
|---|---|---|---|
| Lokenvitz Carl H | $414,000 | Nevada State Title | |
| Kruse Stephen P | $227,500 | National Title Company |
Source: Public Records
Mortgage History
| Date | Status | Borrower | Loan Amount |
|---|---|---|---|
| Open | Lokenvitz Carl H | $393,300 | |
| Previous Owner | Kruse Stephen P | $204,750 |
Source: Public Records
Tax History Compared to Growth
Tax History
| Year | Tax Paid | Tax Assessment Tax Assessment Total Assessment is a certain percentage of the fair market value that is determined by local assessors to be the total taxable value of land and additions on the property. | Land | Improvement |
|---|---|---|---|---|
| 2025 | $2,889 | $127,101 | $45,850 | $81,251 |
| 2024 | $2,805 | $127,101 | $45,850 | $81,251 |
| 2023 | $2,805 | $123,198 | $45,500 | $77,698 |
| 2022 | $2,724 | $110,314 | $38,850 | $71,464 |
| 2021 | $2,644 | $102,200 | $33,950 | $68,250 |
| 2020 | $2,657 | $101,647 | $33,600 | $68,047 |
| 2019 | $2,490 | $98,584 | $31,150 | $67,434 |
| 2018 | $2,417 | $88,841 | $24,150 | $64,691 |
| 2017 | $2,902 | $88,514 | $22,750 | $65,764 |
| 2016 | $2,289 | $85,643 | $18,200 | $67,443 |
| 2015 | $2,284 | $71,126 | $15,750 | $55,376 |
| 2014 | $2,218 | $65,639 | $10,500 | $55,139 |
Source: Public Records
Map
Nearby Homes
- 7425 Enchanted Hills Ct
- 7505 Cobal Canyon Ln
- 7504 Heather Knoll Cir
- 7461 Tahoe Basin Dr
- 4412 N Pioneer Way
- 4404 Dunlap Crossing St Unit 2
- 7433 Alice Springs Cir
- 7418 Lawrence Powers Ct
- 4533 Vogue St
- 7349 Dolphine Crest Ave
- 0 N Tenaya Way
- 4252 Olympic Point Dr
- 7132 Junction Village Ave
- 4216 Thunder Twice St Unit 4A
- 4205 Thunder Twice St
- 3344 Dancing Waters St
- 3350 Dancing Waters St
- 3351 Dancing Waters St
- 4885 N Pioneer Way
- 4450 Palisades Canyon Cir
- 7408 Alcove Glen Ct
- 7413 Cypress Grove Ct
- 7409 Cypress Grove Ct
- 7409 Cypress Grove Ct Unit na
- 7417 Cypress Grove Ct
- 7420 Alcove Glen Ct
- 7404 Alcove Glen Ct
- 7413 Alcove Glen Ct
- 7409 Alcove Glen Ct
- 7421 Cypress Grove Ct
- 7405 Cypress Grove Ct
- 7417 Alcove Glen Ct
- 7405 Alcove Glen Ct
- 7400 Alcove Glen Ct
- 7424 Alcove Glen Ct
- 7421 Alcove Glen Ct
- 7425 Cypress Grove Ct
- 7401 Cypress Grove Ct
- 7401 Alcove Glen Ct
- 7412 Cypress Grove Ct