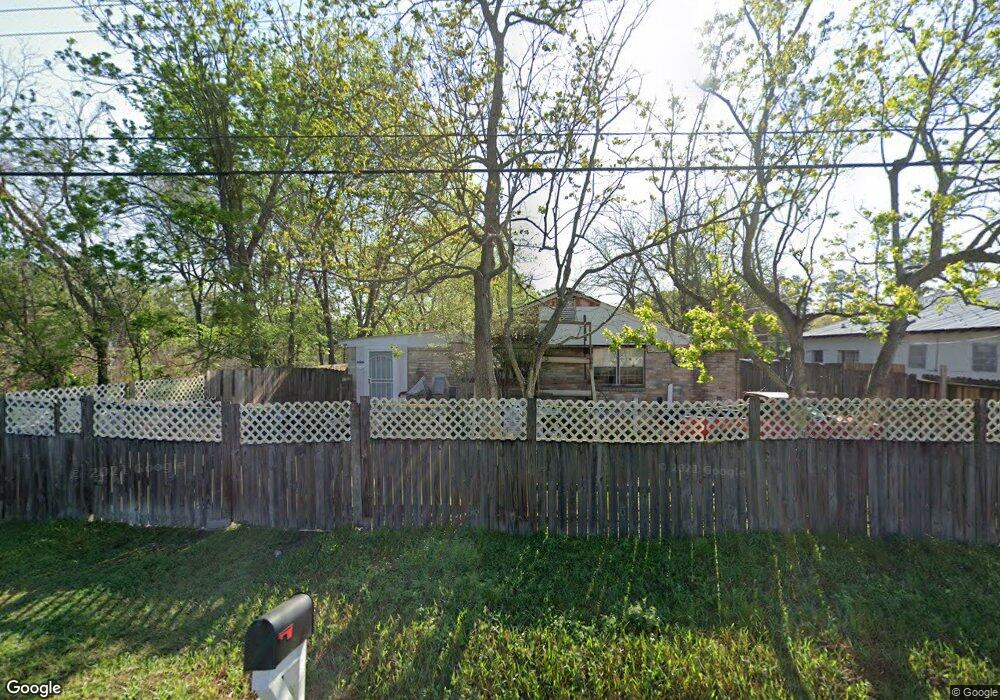
7412 Shotwell St Houston, TX 77028
Trinity-Houston Gardens NeighborhoodEstimated Value: $121,466 - $181,000
2
Beds
1
Bath
1,242
Sq Ft
$125/Sq Ft
Est. Value
About This Home
This home is located at 7412 Shotwell St, Houston, TX 77028 and is currently estimated at $155,117, approximately $124 per square foot. 7412 Shotwell St is a home located in Harris County with nearby schools including Felix Cook Jr. Elementary School, Key Middle, and Kashmere High School.
Ownership History
Date
Name
Owned For
Owner Type
Purchase Details
Closed on
Nov 17, 2006
Sold by
Weststreet Investments Lp
Bought by
Utrilla George
Current Estimated Value
Home Financials for this Owner
Home Financials are based on the most recent Mortgage that was taken out on this home.
Original Mortgage
$34,499
Interest Rate
6.19%
Mortgage Type
Seller Take Back
Purchase Details
Closed on
May 12, 2006
Sold by
Johnson John B and Philips Darlene A
Bought by
Weststreet Investments Lp
Purchase Details
Closed on
Dec 20, 2005
Sold by
Weststreet Investments Lp
Bought by
Johnson John B and Phillips Darlene A
Home Financials for this Owner
Home Financials are based on the most recent Mortgage that was taken out on this home.
Original Mortgage
$43,999
Interest Rate
6.21%
Mortgage Type
Seller Take Back
Purchase Details
Closed on
Mar 4, 2003
Sold by
S & S Investment Co
Bought by
Weststreet Investments Lp
Create a Home Valuation Report for This Property
The Home Valuation Report is an in-depth analysis detailing your home's value as well as a comparison with similar homes in the area
Home Values in the Area
Average Home Value in this Area
Purchase History
| Date | Buyer | Sale Price | Title Company |
|---|---|---|---|
| Utrilla George | -- | None Available | |
| Weststreet Investments Lp | $16,000 | None Available | |
| Johnson John B | -- | None Available | |
| Weststreet Investments Lp | $10,000 | -- |
Source: Public Records
Mortgage History
| Date | Status | Borrower | Loan Amount |
|---|---|---|---|
| Previous Owner | Utrilla George | $34,499 | |
| Previous Owner | Johnson John B | $43,999 |
Source: Public Records
Tax History Compared to Growth
Tax History
| Year | Tax Paid | Tax Assessment Tax Assessment Total Assessment is a certain percentage of the fair market value that is determined by local assessors to be the total taxable value of land and additions on the property. | Land | Improvement |
|---|---|---|---|---|
| 2025 | $778 | $101,531 | $65,155 | $36,376 |
| 2024 | $778 | $98,947 | $65,155 | $33,792 |
| 2023 | $778 | $81,325 | $47,100 | $34,225 |
| 2022 | $773 | $66,029 | $39,250 | $26,779 |
| 2021 | $743 | $51,658 | $29,438 | $22,220 |
| 2020 | $751 | $31,004 | $18,055 | $12,949 |
| 2019 | $667 | $29,224 | $16,485 | $12,739 |
| 2018 | $251 | $23,966 | $14,130 | $9,836 |
| 2017 | $606 | $23,966 | $14,130 | $9,836 |
| 2016 | $584 | $23,966 | $14,130 | $9,836 |
| 2015 | $540 | $21,000 | $11,775 | $9,225 |
| 2014 | $540 | $21,000 | $11,775 | $9,225 |
Source: Public Records
Map
Nearby Homes
- 0 Sandra St Unit 33902265
- 0 Peachtree St Unit 21922779
- 0 Peachtree St Unit 3094206
- 0 Peachtree St Unit 19233458
- 8312 Hoffman St
- 5409-5417 Carey St
- RES 11 Shotwell St
- TBD Shotwell St
- 7524 Peachtree St
- 7312 Wileyvale Rd Unit B
- 7312 Wileyvale Rd Unit D
- 7312 Wileyvale Rd Unit E
- 7312 Wileyvale Rd Unit C
- 7312 Wileyvale Rd Unit A
- 7311 Wileyvale Rd Unit A
- 7311 Wileyvale Rd Unit B
- 6601 Landor St
- 7803 Sandra St Unit A/B
- 6729 Kittridge St
- 7807 Sandra St Unit A/B
- 7416 Shotwell St
- 7408 Shotwell St
- 7420 Shotwell St
- 7411 Hoffman St
- 7421 Hoffman St
- 7316 Shotwell St
- 7417 Hoffman St
- 7407 Hoffman St
- 6618 Shotwell St
- 7413 Shotwell St
- 7413 Shotwell St Unit A
- 7413 Shotwell St
- 7409 Shotwell St
- 7417 Shotwell St
- 7415 Shotwell St Unit B
- 7415 Shotwell St
- 7323 Hoffman St
- 7421 Shotwell St
- 7319 Hoffman St
- 5431 Denmark St