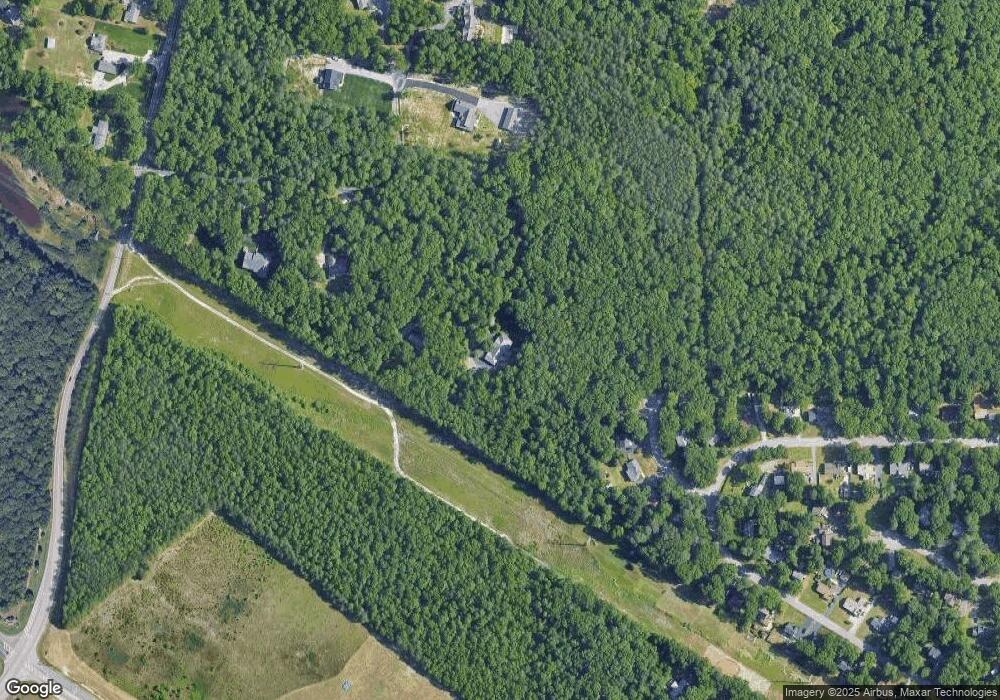
7413 Belmont Downs Mews Chesterfield, VA 23832
Estimated Value: $440,000 - $680,060
3
Beds
3
Baths
2,698
Sq Ft
$223/Sq Ft
Est. Value
About This Home
This home is located at 7413 Belmont Downs Mews, Chesterfield, VA 23832 and is currently estimated at $600,765, approximately $222 per square foot. 7413 Belmont Downs Mews is a home located in Chesterfield County with nearby schools including J G Hening Elementary School, Manchester Middle School, and Meadowbrook High School.
Ownership History
Date
Name
Owned For
Owner Type
Purchase Details
Closed on
Aug 8, 2019
Sold by
Crostic Martha D
Bought by
Gilbert Dean K and Gilbert Sandra F
Current Estimated Value
Home Financials for this Owner
Home Financials are based on the most recent Mortgage that was taken out on this home.
Original Mortgage
$428,695
Outstanding Balance
$375,458
Interest Rate
3.7%
Mortgage Type
VA
Estimated Equity
$225,307
Create a Home Valuation Report for This Property
The Home Valuation Report is an in-depth analysis detailing your home's value as well as a comparison with similar homes in the area
Home Values in the Area
Average Home Value in this Area
Purchase History
| Date | Buyer | Sale Price | Title Company |
|---|---|---|---|
| Gilbert Dean K | $415,000 | Attorney |
Source: Public Records
Mortgage History
| Date | Status | Borrower | Loan Amount |
|---|---|---|---|
| Open | Gilbert Dean K | $428,695 |
Source: Public Records
Tax History Compared to Growth
Tax History
| Year | Tax Paid | Tax Assessment Tax Assessment Total Assessment is a certain percentage of the fair market value that is determined by local assessors to be the total taxable value of land and additions on the property. | Land | Improvement |
|---|---|---|---|---|
| 2025 | $5,638 | $630,700 | $88,100 | $542,600 |
| 2024 | $5,638 | $586,900 | $85,400 | $501,500 |
| 2023 | $4,861 | $534,200 | $81,800 | $452,400 |
| 2022 | $4,590 | $498,900 | $79,100 | $419,800 |
| 2021 | $4,311 | $451,200 | $76,400 | $374,800 |
| 2020 | $3,960 | $416,800 | $76,400 | $340,400 |
| 2019 | $3,751 | $394,800 | $76,400 | $318,400 |
| 2018 | $3,596 | $378,600 | $74,600 | $304,000 |
| 2017 | $3,545 | $364,100 | $70,600 | $293,500 |
| 2016 | $3,290 | $342,700 | $69,000 | $273,700 |
| 2015 | $3,239 | $334,800 | $69,000 | $265,800 |
| 2014 | $3,239 | $334,800 | $69,000 | $265,800 |
Source: Public Records
Map
Nearby Homes
- 7813 Centerbrook Place
- 6106 Whisperwood Dr
- 6112 Whisperwood Dr
- 909 Scott Bluff Terrace
- 913 Scott Bluff Terrace
- 911 Scott Bluff Terrace
- 927 Scott Bluff Terrace
- 917 Scott Bluff Terrace
- 923 Scott Bluff Terrace
- 907 Scott Bluff Terrace
- 915 Scott Bluff Terrace
- 6101 Whisperwood Dr
- 7007 Greenholm Place
- 6113 Whisperwood Dr
- 6119 Whisperwood Dr
- 6207 Whisperwood Dr
- 6125 Waterman Place
- 6907 Sanguine Terrace
- 6406 Lake Caroline Ct
- 7279 Crosswinds Dr
- 7419 Belmont Downs Mews
- 6900 Oakhill Ln
- 6906 Oakhill Ln
- 6912 Oakhill Ln
- 6800 Oakhill Ln
- 6901 Oakhill Ln
- 7425 Belmont Downs Mews
- 6918 Oakhill Ln
- 6911 Oakhill Ln
- 7407 Sparkleberry Ln
- 8010 Cogbill Rd
- 7654 Robinwood Dr
- 7771 Belmont Rd
- 7700 Robinwood Dr
- 7648 Robinwood Dr
- 7431 Sparkleberry Ln
- 7706 Robinwood Dr
- 7642 Robinwood Dr
- 7653 Robinwood Dr
- 7406 Sparkleberry Ln
