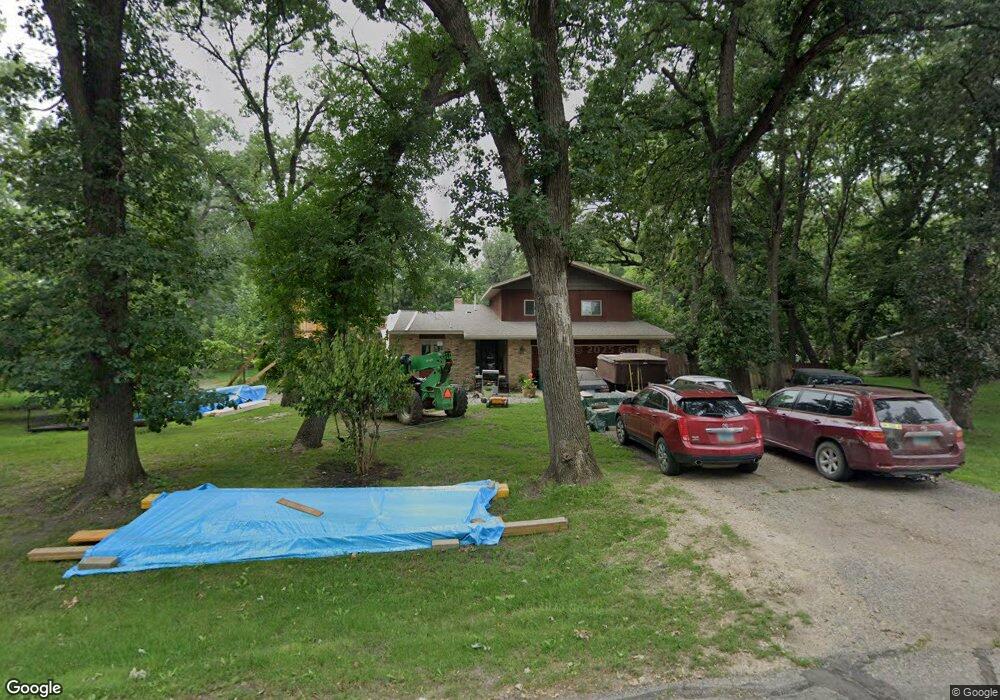
7413 Ellis Ln Horace, ND 58047
Estimated Value: $456,812 - $613,000
4
Beds
2
Baths
2,316
Sq Ft
$227/Sq Ft
Est. Value
About This Home
This home is located at 7413 Ellis Ln, Horace, ND 58047 and is currently estimated at $526,453, approximately $227 per square foot. 7413 Ellis Ln is a home located in Cass County with nearby schools including Horace Elementary School, Liberty Middle School, and West Fargo Sheyenne High School.
Ownership History
Date
Name
Owned For
Owner Type
Purchase Details
Closed on
Sep 1, 2015
Sold by
Bosch Edward and Bosch Eleanor T
Bought by
Allex Grant and Allex Patti
Current Estimated Value
Home Financials for this Owner
Home Financials are based on the most recent Mortgage that was taken out on this home.
Original Mortgage
$200,000
Outstanding Balance
$157,781
Interest Rate
4.04%
Mortgage Type
New Conventional
Estimated Equity
$368,672
Purchase Details
Closed on
Jan 22, 2010
Sold by
Borgen Chad R and Borgen Heidi
Bought by
Allex Grant and Allex Patti
Home Financials for this Owner
Home Financials are based on the most recent Mortgage that was taken out on this home.
Original Mortgage
$120,065
Interest Rate
5%
Mortgage Type
FHA
Purchase Details
Closed on
Nov 15, 2007
Sold by
Borgen Chad and Borgen Heidi
Bought by
Allex Grant and Allex Patti
Create a Home Valuation Report for This Property
The Home Valuation Report is an in-depth analysis detailing your home's value as well as a comparison with similar homes in the area
Home Values in the Area
Average Home Value in this Area
Purchase History
| Date | Buyer | Sale Price | Title Company |
|---|---|---|---|
| Allex Grant | -- | None Available | |
| Allex Grant | $224,000 | -- | |
| Allex Grant | -- | -- |
Source: Public Records
Mortgage History
| Date | Status | Borrower | Loan Amount |
|---|---|---|---|
| Open | Allex Grant | $200,000 | |
| Previous Owner | Allex Grant | $120,065 |
Source: Public Records
Tax History
| Year | Tax Paid | Tax Assessment Tax Assessment Total Assessment is a certain percentage of the fair market value that is determined by local assessors to be the total taxable value of land and additions on the property. | Land | Improvement |
|---|---|---|---|---|
| 2024 | $4,814 | $209,150 | $35,200 | $173,950 |
| 2023 | $5,223 | $205,400 | $35,200 | $170,200 |
| 2022 | $5,055 | $190,500 | $29,200 | $161,300 |
| 2021 | $4,964 | $183,150 | $29,200 | $153,950 |
| 2020 | $4,837 | $179,900 | $29,200 | $150,700 |
| 2019 | $3,596 | $131,250 | $20,700 | $110,550 |
| 2018 | $3,447 | $131,250 | $20,700 | $110,550 |
| 2017 | $3,158 | $126,200 | $19,900 | $106,300 |
| 2016 | $2,604 | $122,500 | $19,300 | $103,200 |
| 2015 | $2,562 | $113,400 | $17,850 | $95,550 |
| 2014 | $2,461 | $110,100 | $17,350 | $92,750 |
| 2013 | $2,274 | $100,050 | $15,750 | $84,300 |
Source: Public Records
Map
Nearby Homes
- 7411 Elm Ct
- 8143 75th St S
- 8131 75th St S
- 8137 75th St S
- 8138 75th St S
- 8132 75th St S
- 8120 75th St S
- 8119 75th St S
- 8113 75th St S
- 8114 75th St S
- 8108 75th St S
- 8125 75th St S
- 8126 75th St S
- 8107 75th St S
- 7634 Whitman Dr
- 7628 Whitman Dr
- 7640 Whitman Dr
- 7622 Whitman Dr
- 8142 Kirkwood Dr
- 7646 Whitman Dr
Your Personal Tour Guide
Ask me questions while you tour the home.