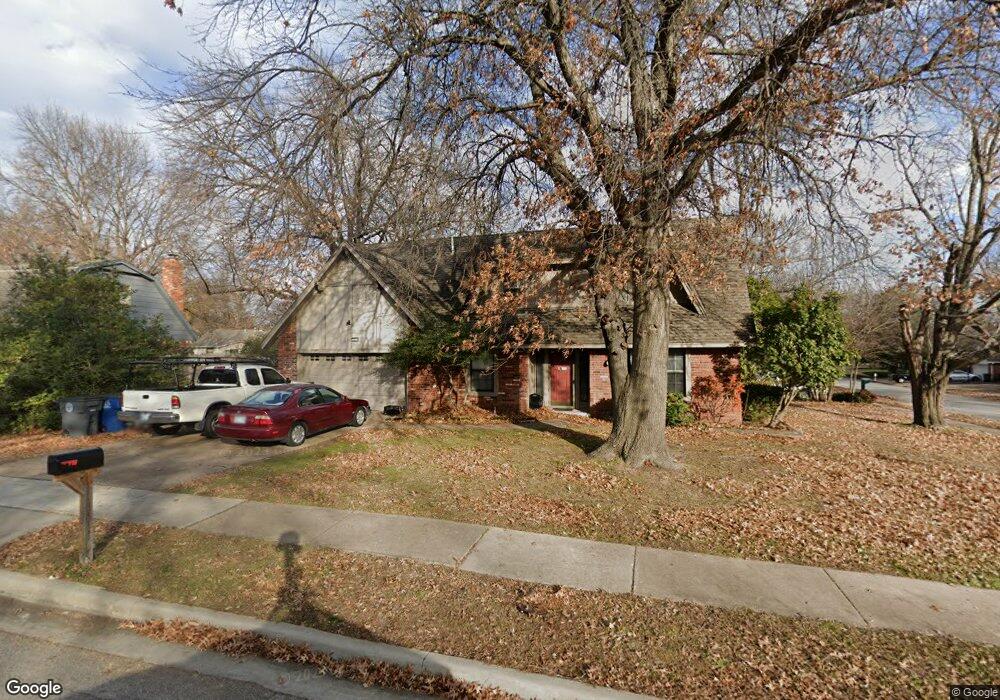
7415 S 73rd East Ave Tulsa, OK 74133
Sheridan Valley NeighborhoodEstimated Value: $261,579 - $285,000
3
Beds
3
Baths
2,113
Sq Ft
$130/Sq Ft
Est. Value
About This Home
This home is located at 7415 S 73rd East Ave, Tulsa, OK 74133 and is currently estimated at $274,645, approximately $129 per square foot. 7415 S 73rd East Ave is a home located in Tulsa County with nearby schools including Grissom Elementary School, Memorial Middle School, and Memorial High School.
Ownership History
Date
Name
Owned For
Owner Type
Purchase Details
Closed on
May 30, 2017
Sold by
Fichtenberg Kurt Lars
Bought by
Fichtenberg Kurt Lars
Current Estimated Value
Purchase Details
Closed on
Jun 16, 2006
Sold by
Howard Travis and Howard Shannon
Bought by
Fichtenberg Kurt L and Fichtenberg Tiffany L
Home Financials for this Owner
Home Financials are based on the most recent Mortgage that was taken out on this home.
Original Mortgage
$109,600
Interest Rate
6.56%
Mortgage Type
Purchase Money Mortgage
Purchase Details
Closed on
May 7, 2001
Sold by
Ashworth Robert Lee and Ashworth Amy Anne
Bought by
Howard Travis and Howard Shannon
Purchase Details
Closed on
Jul 2, 1997
Sold by
Ashworth Robert Lee and Ashworth Beverly
Bought by
Ashworth Robert Lee and Ashworth Amy Anne
Purchase Details
Closed on
Jun 27, 1997
Sold by
Nelson Gary L and Nelson Sue C
Bought by
Ashworth Beverly
Create a Home Valuation Report for This Property
The Home Valuation Report is an in-depth analysis detailing your home's value as well as a comparison with similar homes in the area
Home Values in the Area
Average Home Value in this Area
Purchase History
| Date | Buyer | Sale Price | Title Company |
|---|---|---|---|
| Fichtenberg Kurt Lars | -- | None Available | |
| Fichtenberg Kurt L | $137,000 | None Available | |
| Howard Travis | $121,500 | Tulsa Abstract & Title Co | |
| Ashworth Robert Lee | -- | Guaranty Abstract Company | |
| Ashworth Beverly | $108,000 | Guaranty Abstract Company |
Source: Public Records
Mortgage History
| Date | Status | Borrower | Loan Amount |
|---|---|---|---|
| Closed | Fichtenberg Kurt L | $109,600 |
Source: Public Records
Tax History Compared to Growth
Tax History
| Year | Tax Paid | Tax Assessment Tax Assessment Total Assessment is a certain percentage of the fair market value that is determined by local assessors to be the total taxable value of land and additions on the property. | Land | Improvement |
|---|---|---|---|---|
| 2024 | $1,854 | $15,078 | $1,538 | $13,540 |
| 2023 | $1,854 | $15,610 | $1,744 | $13,866 |
| 2022 | $1,887 | $14,155 | $2,646 | $11,509 |
| 2021 | $1,811 | $13,713 | $2,563 | $11,150 |
| 2020 | $1,786 | $13,713 | $2,563 | $11,150 |
| 2019 | $1,879 | $13,713 | $2,563 | $11,150 |
| 2018 | $2,133 | $15,530 | $2,800 | $12,730 |
| 2017 | $2,063 | $16,049 | $2,893 | $13,156 |
| 2016 | $2,020 | $16,049 | $2,893 | $13,156 |
| 2015 | $2,128 | $16,049 | $2,893 | $13,156 |
| 2014 | $2,008 | $15,070 | $2,893 | $12,177 |
Source: Public Records
Map
Nearby Homes
- 7327 E 75th St
- 7743 S 73rd East Ave
- 7755 S 73rd East Ave
- 7809 E 77th Place
- 6931 E 78th St
- 7802 S 72nd East Ave
- 7315 S 69th East Place
- 6914 E 73rd St
- 7736 S 69th East Ave
- 7510 S 82nd East Ave
- 7362 S 68th East Ave
- 7605 S Sheridan Rd
- 6915 S 77th East Ave
- 6635 E 72nd Place
- 6625 E 72nd Place
- 6821 E 79th St
- 8310 E 74th Ct
- 6815 E 79th St
- 7414 S 84th East Ave
- 6606 E 72nd Place
- 7309 E 75th St
- 7409 S 73rd East Ave
- 7304 E 75th St
- 7315 E 75th St
- 7403 S 73rd East Ave
- 7412 S 73rd East Ave
- 7420 S 73rd East Ave
- 7310 E 75th St
- 7302 E 74th St
- 7214 E 74th St
- 7306 E 74th St
- 7502 S 73rd East Ave
- 7343 S 73rd East Ave
- 7321 E 75th St
- 7508 S 73rd East Ave
- 7301 E 74th St
- 7511 S 73rd East Ave
- 7511 S 73rd East Ave
- 7322 E 75th St
- 7310 E 74th St