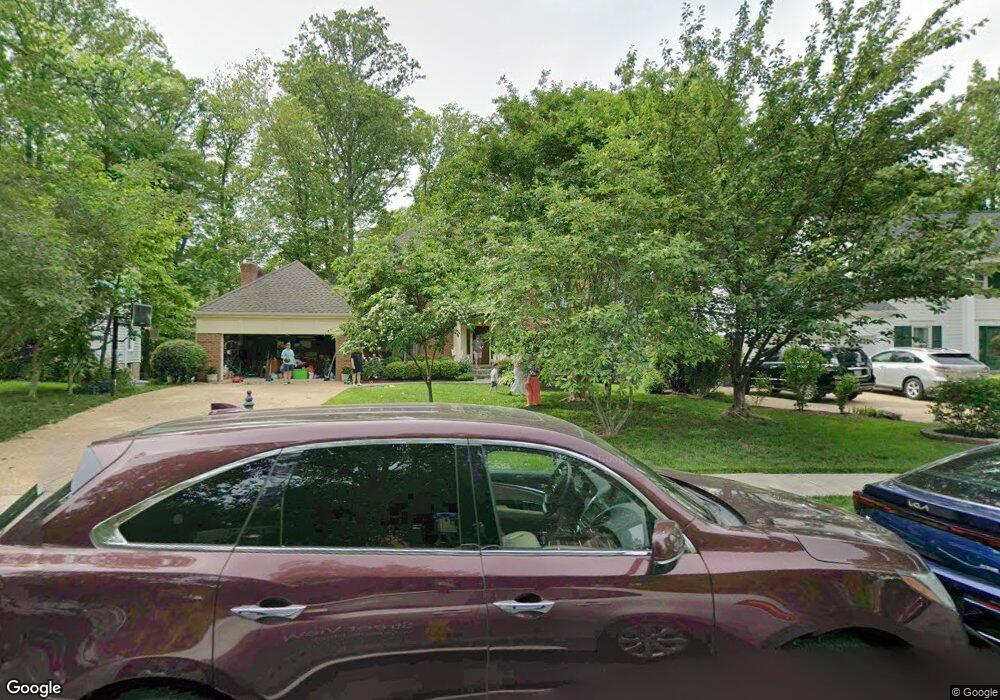
7416 Brian Run Ct Springfield, VA 22153
Estimated Value: $922,000 - $1,018,000
5
Beds
4
Baths
2,602
Sq Ft
$378/Sq Ft
Est. Value
About This Home
This home is located at 7416 Brian Run Ct, Springfield, VA 22153 and is currently estimated at $984,333, approximately $378 per square foot. 7416 Brian Run Ct is a home located in Fairfax County with nearby schools including Sangster Elementary School, Irving Middle School, and West Springfield High School.
Ownership History
Date
Name
Owned For
Owner Type
Purchase Details
Closed on
May 24, 1996
Sold by
Coster Jeffrey S
Bought by
Cafferky John F
Current Estimated Value
Home Financials for this Owner
Home Financials are based on the most recent Mortgage that was taken out on this home.
Original Mortgage
$268,000
Outstanding Balance
$15,284
Interest Rate
8.01%
Estimated Equity
$969,049
Create a Home Valuation Report for This Property
The Home Valuation Report is an in-depth analysis detailing your home's value as well as a comparison with similar homes in the area
Home Values in the Area
Average Home Value in this Area
Purchase History
We collect this data history from publicly available records. To have your information removed, we recommend requesting removal directly through your county’s website.
| Date | Buyer | Sale Price | Title Company |
|---|---|---|---|
| Cafferky John F | $335,000 | -- |
Source: Public Records
Mortgage History
We collect this data history from publicly available records. To have your information removed, we recommend requesting removal directly through your county’s website.
| Date | Status | Borrower | Loan Amount |
|---|---|---|---|
| Open | Cafferky John F | $268,000 | |
| Closed | Cafferky John F | $50,000 |
Source: Public Records
Tax History
| Year | Tax Paid | Tax Assessment Tax Assessment Total Assessment is a certain percentage of the fair market value that is determined by local assessors to be the total taxable value of land and additions on the property. | Land | Improvement |
|---|---|---|---|---|
| 2025 | $10,932 | $979,690 | $323,000 | $656,690 |
| 2024 | $10,932 | $943,620 | $313,000 | $630,620 |
| 2023 | $10,022 | $888,120 | $298,000 | $590,120 |
| 2022 | $9,631 | $842,240 | $288,000 | $554,240 |
| 2021 | $8,820 | $751,570 | $258,000 | $493,570 |
| 2020 | $8,354 | $705,840 | $243,000 | $462,840 |
| 2019 | $7,930 | $670,020 | $233,000 | $437,020 |
| 2018 | $7,718 | $671,150 | $233,000 | $438,150 |
| 2017 | $7,618 | $656,150 | $218,000 | $438,150 |
| 2016 | $7,711 | $665,580 | $223,000 | $442,580 |
| 2015 | $7,040 | $630,820 | $208,000 | $422,820 |
| 2014 | $6,659 | $598,010 | $198,000 | $400,010 |
Source: Public Records
Map
Nearby Homes
- 9323 Castle Hill Rd
- 9202 Dorothy Ln
- 7168 Game Lord Dr
- 7628 Gralnick Place
- 7137 Game Lord Dr
- 7801 Huntsman Blvd
- 9385 Saddlemount Ct
- 7603 Modisto Ln
- 7710 Wilbur Ct
- 7100 Counter Place
- 9103 Northedge Dr
- 9117 Galbreth Ct
- 7601 Cervantes Ct
- 7207 Neaptide Ln
- 9217 Rockefeller Ln
- 9127 Scott St
- 7011 Spaniel Rd
- 7512 Rambling Ridge Dr
- 9011 Scott St
- 7522 Rambling Ridge Dr
- 7414 Brian Run Ct
- 7418 Brian Run Ct
- 9401 Park Hunt Ct
- 9403 Park Hunt Ct
- 9405 Park Hunt Ct
- 9407 Park Hunt Ct
- 9400 Park Hunt Ct
- 7415 Brian Run Ct
- 7420 Brian Run Ct
- 7422 Tomcris Ct
- 9411 Park Hunt Ct
- 9402 Park Hunt Ct
- 7421 Tomcris Ct
- 9321 Elk Dr
- 9413 Park Hunt Ct
- 9404 Park Hunt Ct
- 7413 Brian Run Ct
- 9415 Park Hunt Ct
- 7419 Brian Run Ct
- 7422 Brian Run Ct
Your Personal Tour Guide
Ask me questions while you tour the home.