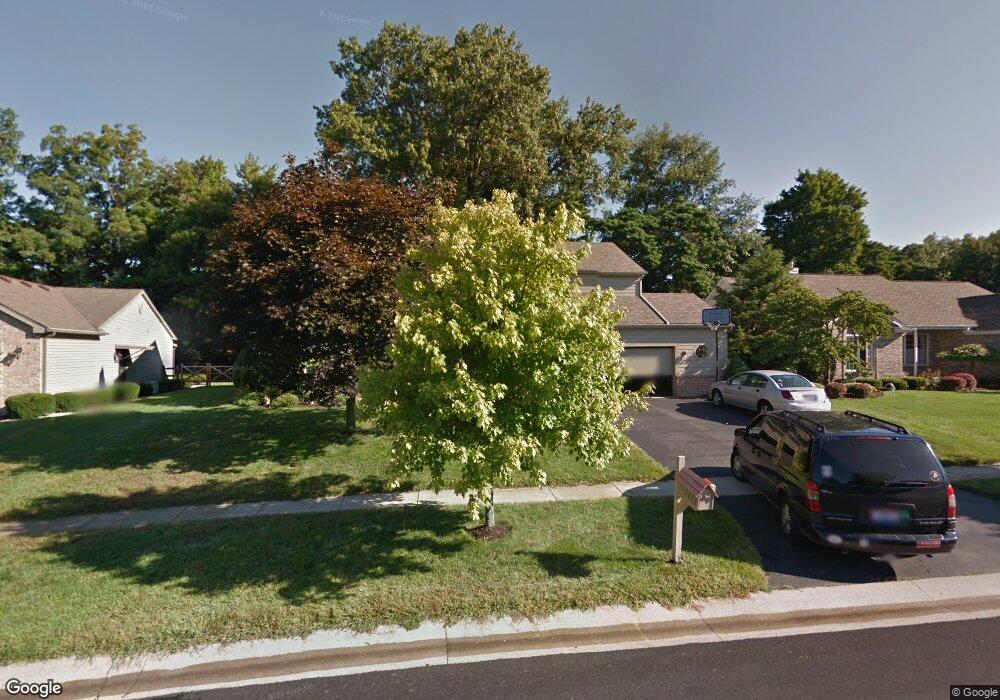
7416 Country Meadow Ct Sylvania, OH 43560
Estimated Value: $392,000 - $513,000
4
Beds
3
Baths
2,815
Sq Ft
$155/Sq Ft
Est. Value
About This Home
This home is located at 7416 Country Meadow Ct, Sylvania, OH 43560 and is currently estimated at $436,807, approximately $155 per square foot. 7416 Country Meadow Ct is a home located in Lucas County with nearby schools including Maplewood Elementary School, Sylvania McCord Junior High School, and Sylvania Northview High School.
Ownership History
Date
Name
Owned For
Owner Type
Purchase Details
Closed on
Mar 29, 1999
Sold by
Melamed Mark and Melamed Yevgenya
Bought by
Langenderfer Brian A and Langenderfer Andrea H
Current Estimated Value
Purchase Details
Closed on
Mar 23, 1995
Sold by
M L Wilson Builder Inc
Bought by
Melamed Mark
Home Financials for this Owner
Home Financials are based on the most recent Mortgage that was taken out on this home.
Original Mortgage
$146,700
Interest Rate
8%
Mortgage Type
New Conventional
Purchase Details
Closed on
Feb 13, 1995
Sold by
Mercurio Dev Inc
Bought by
Mcwilson Builder Inc
Home Financials for this Owner
Home Financials are based on the most recent Mortgage that was taken out on this home.
Original Mortgage
$146,700
Interest Rate
8%
Mortgage Type
New Conventional
Create a Home Valuation Report for This Property
The Home Valuation Report is an in-depth analysis detailing your home's value as well as a comparison with similar homes in the area
Home Values in the Area
Average Home Value in this Area
Purchase History
| Date | Buyer | Sale Price | Title Company |
|---|---|---|---|
| Langenderfer Brian A | $195,000 | -- | |
| Melamed Mark | $34,900 | -- | |
| Mcwilson Builder Inc | $64,800 | -- |
Source: Public Records
Mortgage History
| Date | Status | Borrower | Loan Amount |
|---|---|---|---|
| Closed | Melamed Mark | $146,700 | |
| Closed | Mcwilson Builder Inc | $48,600 |
Source: Public Records
Tax History Compared to Growth
Tax History
| Year | Tax Paid | Tax Assessment Tax Assessment Total Assessment is a certain percentage of the fair market value that is determined by local assessors to be the total taxable value of land and additions on the property. | Land | Improvement |
|---|---|---|---|---|
| 2024 | $4,470 | $138,460 | $20,615 | $117,845 |
| 2023 | $7,571 | $100,415 | $14,875 | $85,540 |
| 2022 | $7,575 | $100,415 | $14,875 | $85,540 |
| 2021 | $7,757 | $100,415 | $14,875 | $85,540 |
| 2020 | $7,291 | $83,510 | $12,250 | $71,260 |
| 2019 | $7,024 | $83,510 | $12,250 | $71,260 |
| 2018 | $6,924 | $83,510 | $12,250 | $71,260 |
| 2017 | $7,387 | $80,045 | $11,900 | $68,145 |
| 2016 | $7,247 | $228,700 | $34,000 | $194,700 |
| 2015 | $6,835 | $228,700 | $34,000 | $194,700 |
| 2014 | $6,806 | $80,930 | $11,450 | $69,480 |
| 2013 | $6,806 | $80,930 | $11,450 | $69,480 |
Source: Public Records
Map
Nearby Homes
- 4504 Promenade Ln
- 7428 Kings Walk Ln
- 7565 Peachtree Ln
- 9516 Paradise Ln
- 8826 Flint Ct
- 8729 Harlow Ct
- 8816 Harlow Ct
- 8801 Harlow Ct
- 8753 Harlow Ct
- 9017 Driftwood Ct
- 4731 Weldwood Ln
- 4610 Woodland Ln
- 7345 Country Commons Ln
- 4271 Cranberry Ln
- 4533 Gettysburg Dr
- 7413 Sylvania Ave
- 4850 Tamworth Rd
- 7723 Sylvan Oaks Way
- 6922 Gettysburg Dr
- 4814 Sylvan Ct
- 7424 Country Meadow Ct
- 7408 Country Meadow Ct
- 4512 Promenade Ln
- 4516 Promenade Ln
- 7432 Country Meadow Ct
- 7400 Country Meadow Ct
- 7419 Country Meadow Ct
- 7411 Country Meadow Ct
- 7427 Country Meadow Ct
- 7403 Country Meadow Ct
- 7440 Country Meadow Ct
- 7362 Country Meadow Ct
- 4508 Promenade Ln
- 7435 Country Meadow Ct
- 7363 Country Meadow Ct
- 4520 Promenade Ln
- 7352 Country Meadow Ct
- 7355 Country Meadow Ct
- 7443 Country Meadow Ct
- 4515 Promenade Ln