Estimated Value: $277,000 - $322,000
3
Beds
2
Baths
1,620
Sq Ft
$185/Sq Ft
Est. Value
About This Home
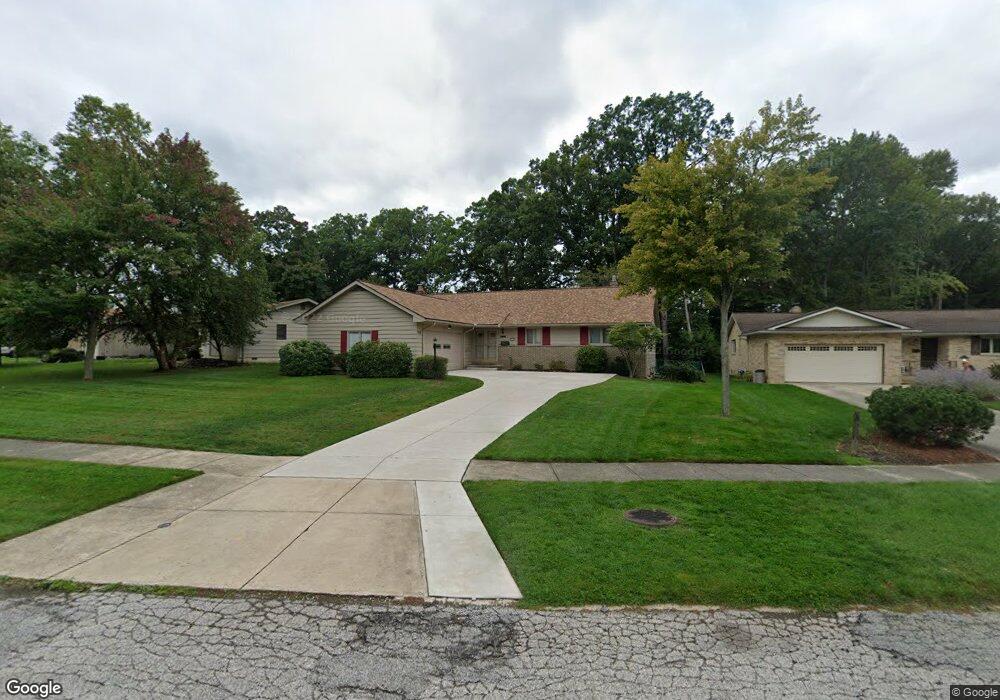
This home is located at 7418 Wake Robin Dr, Parma, OH 44130 and is currently estimated at $298,996, approximately $184 per square foot. 7418 Wake Robin Dr is a home located in Cuyahoga County with nearby schools including Pleasant Valley Elementary School, Greenbriar Middle School, and Valley Forge High School.
Ownership History
Date
Name
Owned For
Owner Type
Purchase Details
Closed on
Aug 15, 2019
Sold by
Jasko Raymond F and Jasko Mary Lou
Bought by
Jasko Raymond F
Current Estimated Value
Purchase Details
Closed on
Sep 12, 2002
Sold by
Jasko Raymond F and Jasko Mary Lou
Bought by
Jasko Raymond F and Jasko Mary Lou
Purchase Details
Closed on
Mar 16, 1998
Sold by
Passick Debra M
Bought by
Jasko Raymond F and Jasko Mary L
Home Financials for this Owner
Home Financials are based on the most recent Mortgage that was taken out on this home.
Original Mortgage
$30,000
Interest Rate
7.14%
Mortgage Type
Purchase Money Mortgage
Purchase Details
Closed on
Jun 24, 1992
Sold by
Macula Georgine
Bought by
Passick Debra M
Purchase Details
Closed on
Nov 19, 1991
Sold by
Gizzi Annabelle
Bought by
Macula Georgine
Purchase Details
Closed on
Jan 1, 1984
Bought by
Gizzi Annabelle
Create a Home Valuation Report for This Property
The Home Valuation Report is an in-depth analysis detailing your home's value as well as a comparison with similar homes in the area
Home Values in the Area
Average Home Value in this Area
Purchase History
| Date | Buyer | Sale Price | Title Company |
|---|---|---|---|
| Jasko Raymond F | -- | None Available | |
| Jasko Raymond F | -- | -- | |
| Jasko Raymond F | $152,500 | Guardian Title | |
| Passick Debra M | $129,900 | -- | |
| Macula Georgine | -- | -- | |
| Gizzi Annabelle | -- | -- |
Source: Public Records
Mortgage History
| Date | Status | Borrower | Loan Amount |
|---|---|---|---|
| Previous Owner | Jasko Raymond F | $30,000 |
Source: Public Records
Tax History
| Year | Tax Paid | Tax Assessment Tax Assessment Total Assessment is a certain percentage of the fair market value that is determined by local assessors to be the total taxable value of land and additions on the property. | Land | Improvement |
|---|---|---|---|---|
| 2024 | $5,085 | $92,400 | $22,190 | $70,210 |
| 2023 | $3,817 | $61,670 | $15,190 | $46,480 |
| 2022 | $3,810 | $61,670 | $15,190 | $46,480 |
| 2021 | $3,918 | $61,670 | $15,190 | $46,480 |
| 2020 | $3,618 | $51,840 | $12,780 | $39,060 |
| 2019 | $3,467 | $148,100 | $36,500 | $111,600 |
| 2018 | $3,218 | $51,840 | $12,780 | $39,060 |
| 2017 | $3,104 | $44,110 | $9,560 | $34,550 |
| 2016 | $3,085 | $44,110 | $9,560 | $34,550 |
| 2015 | $2,938 | $44,110 | $9,560 | $34,550 |
| 2014 | $2,938 | $44,110 | $9,560 | $34,550 |
Source: Public Records
Map
Nearby Homes
- 8501 Pin Oak Dr
- 9999 Reichert Rd
- 10000 Munich Dr
- L 5B S South Pointe Ln
- L 5D S South Pointe Ln
- Rosecliff Plan at South Pointe - Townhomes
- L 6A S South Pointe Ln
- Caroline w/ Covered Rear Porch Plan at South Pointe - Townhomes
- 10114 Vienna Dr
- 10334 Moore Dr
- 10212 Vienna Dr
- 7257 Barton Cir
- 8012 Fenway Dr
- 8375 Royal Ridge Dr
- 7500 Romilly Oval
- 6888 Reid Dr
- 11183 Johnson Dr
- 6849 Lantern Ln
- 7610 Royal Ridge Dr
- 6846 Revere Rd
- 7502 Wake Robin Dr
- 7416 Wake Robin Dr
- 7504 Wake Robin Dr
- 7414 Wake Robin Dr
- 9000 Sapphire Ct
- 9030 Sapphire Ct
- 7506 Wake Robin Dr
- 7417 Wake Robin Dr
- 7415 Wake Robin Dr
- 7413 Wake Robin Dr
- 7501 Wake Robin Dr
- 7503 Wake Robin Dr
- 9005 Sapphire Ct
- 7412 Wake Robin Dr
- 9060 Sapphire Ct
- 7505 Wake Robin Dr
- 7508 Wake Robin Dr
- 7410 Wake Robin Dr
- 9035 Sapphire Ct
- 7507 Wake Robin Dr