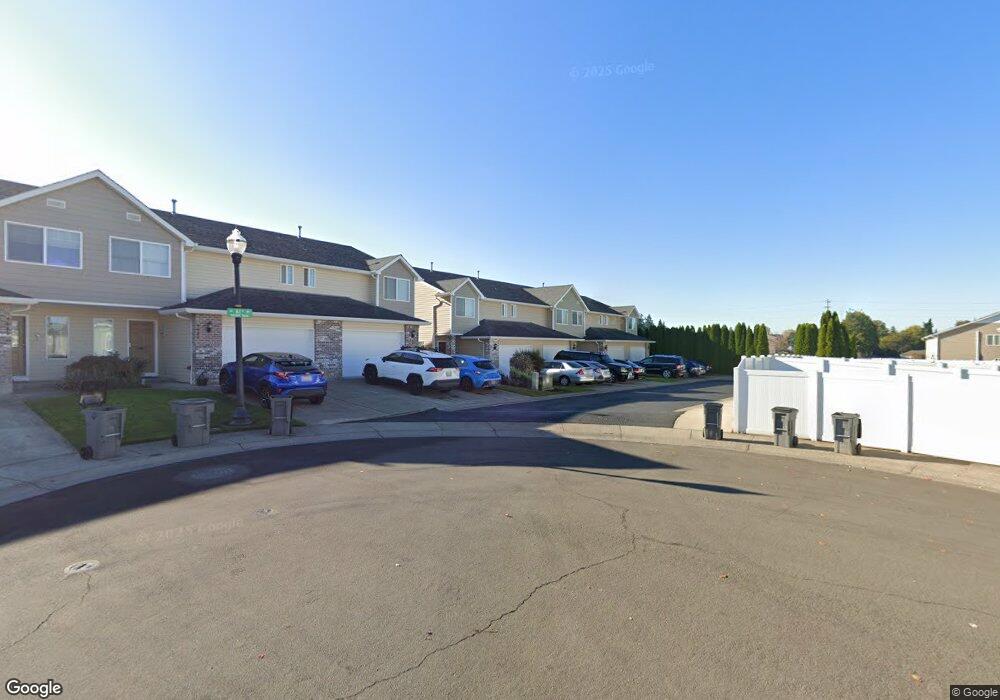
7419 NE 61st Way Vancouver, WA 98662
Minnehaha NeighborhoodEstimated Value: $417,465 - $440,000
3
Beds
3
Baths
1,688
Sq Ft
$256/Sq Ft
Est. Value
About This Home
This home is located at 7419 NE 61st Way, Vancouver, WA 98662 and is currently estimated at $432,866, approximately $256 per square foot. 7419 NE 61st Way is a home located in Clark County with nearby schools including Walnut Grove Elementary, Gaiser Middle School, and Fort Vancouver High School.
Ownership History
Date
Name
Owned For
Owner Type
Purchase Details
Closed on
Apr 9, 2021
Sold by
Moore Jade L Coffman and Moore Brenton A
Bought by
Moore Jade L Coffman and Moore Brenton A
Current Estimated Value
Purchase Details
Closed on
Jul 26, 2012
Sold by
Moore Jade Lee Coffman
Bought by
Moore Jade L Coffman and Moore Brenton A
Home Financials for this Owner
Home Financials are based on the most recent Mortgage that was taken out on this home.
Original Mortgage
$182,550
Outstanding Balance
$126,343
Interest Rate
3.65%
Mortgage Type
New Conventional
Estimated Equity
$306,523
Purchase Details
Closed on
Jun 25, 2007
Sold by
Coffman Bert
Bought by
Coffman May Yee
Home Financials for this Owner
Home Financials are based on the most recent Mortgage that was taken out on this home.
Original Mortgage
$184,720
Interest Rate
6.21%
Mortgage Type
Purchase Money Mortgage
Create a Home Valuation Report for This Property
The Home Valuation Report is an in-depth analysis detailing your home's value as well as a comparison with similar homes in the area
Home Values in the Area
Average Home Value in this Area
Purchase History
| Date | Buyer | Sale Price | Title Company |
|---|---|---|---|
| Moore Jade L Coffman | -- | None Available | |
| Moore Jade L Coffman | -- | Stewart Title | |
| Coffman May Yee | -- | First American Title | |
| Coffman May Yee | $230,992 | First American Title |
Source: Public Records
Mortgage History
| Date | Status | Borrower | Loan Amount |
|---|---|---|---|
| Open | Moore Jade L Coffman | $182,550 | |
| Closed | Coffman May Yee | $184,720 |
Source: Public Records
Tax History Compared to Growth
Tax History
| Year | Tax Paid | Tax Assessment Tax Assessment Total Assessment is a certain percentage of the fair market value that is determined by local assessors to be the total taxable value of land and additions on the property. | Land | Improvement |
|---|---|---|---|---|
| 2025 | $3,572 | $383,589 | $165,400 | $218,189 |
| 2024 | $3,422 | $364,562 | $165,400 | $199,162 |
| 2023 | $3,218 | $364,332 | $165,400 | $198,932 |
| 2022 | $3,203 | $343,904 | $154,032 | $189,872 |
| 2021 | $3,035 | $318,946 | $143,000 | $175,946 |
| 2020 | $2,857 | $284,741 | $91,200 | $193,541 |
| 2019 | $2,548 | $277,135 | $82,800 | $194,335 |
| 2018 | $2,923 | $256,788 | $0 | $0 |
| 2017 | $2,654 | $244,289 | $0 | $0 |
| 2016 | $2,520 | $225,274 | $0 | $0 |
| 2015 | $2,634 | $196,346 | $0 | $0 |
| 2014 | -- | $193,747 | $0 | $0 |
| 2013 | -- | $183,548 | $0 | $0 |
Source: Public Records
Map
Nearby Homes
- 7517 NE 64th Cir
- 7006 NE 61st St
- 5809 NE 71st Ave
- 6209 NE 79th Ct
- 7316 NE 66th St
- 8015 NE 61st St
- 5812 NE 80th Ct
- 6016 NE 81st Ave
- 5700 NE 82nd Ave Unit C15
- 5700 NE 82nd Ave Unit 32F
- 7509 NE 53rd St
- 5317 NE 75th Ave Unit 50
- 6217 NE 82nd Ave
- 6214 NE 84th Ave
- 5226 NE 74th Ct
- 6504 NE 66th Ave
- 6705 NE 55th St
- 5409 NE 66th Ave
- 8406 NE 60th St
- 5408 NE 66th Ave
- 7423 NE 61st Way
- 7415 NE 61st Way
- 7427 NE 61st Way
- 7431 NE 61st Way
- 7435 NE 61st Way
- 7503 NE 61st Way
- 7417 NE 62nd St
- 7421 NE 62nd St
- 7418 NE 61st Way
- 7413 NE 62nd St
- 7425 NE 62nd St
- 7422 NE 61st Way
- 7429 NE 62nd St
- 7507 NE 61st Way
- 7409 NE 62nd St
- 7433 NE 62nd St
- 7405 NE 62nd St
- 7511 NE 61st Way
- 7401 NE 62nd St
- 7515 NE 61st Way