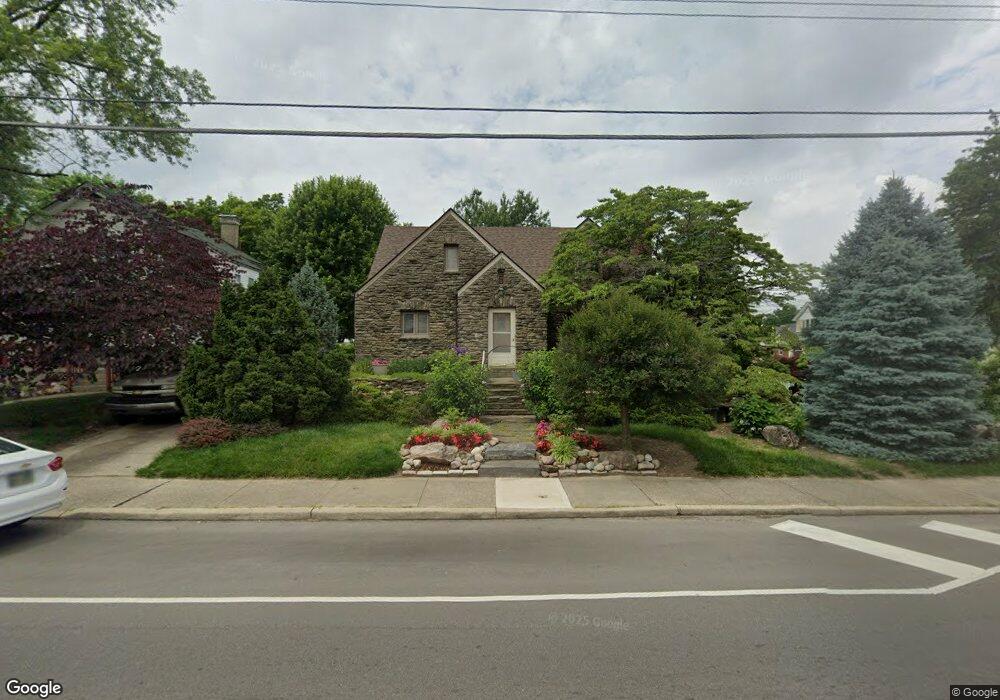
7419 Plainfield Rd Cincinnati, OH 45236
Estimated Value: $323,399 - $359,000
3
Beds
2
Baths
1,793
Sq Ft
$191/Sq Ft
Est. Value
About This Home
This home is located at 7419 Plainfield Rd, Cincinnati, OH 45236 and is currently estimated at $343,100, approximately $191 per square foot. 7419 Plainfield Rd is a home located in Hamilton County with nearby schools including Amity Elementary School, Deer Park Jr/Sr High School, and Ohr Torah Cincinnati.
Ownership History
Date
Name
Owned For
Owner Type
Purchase Details
Closed on
Feb 1, 2005
Sold by
Lane Larry L and Lane Judith A
Bought by
Diebold John A and Diebold Linda S
Current Estimated Value
Home Financials for this Owner
Home Financials are based on the most recent Mortgage that was taken out on this home.
Original Mortgage
$139,900
Outstanding Balance
$68,028
Interest Rate
5.5%
Mortgage Type
Fannie Mae Freddie Mac
Estimated Equity
$275,072
Purchase Details
Closed on
May 23, 1995
Sold by
Pritchard John E and Pritchard Mary Julie
Bought by
Lane Larry L and Lane Judith A
Home Financials for this Owner
Home Financials are based on the most recent Mortgage that was taken out on this home.
Original Mortgage
$111,845
Interest Rate
8.5%
Mortgage Type
VA
Create a Home Valuation Report for This Property
The Home Valuation Report is an in-depth analysis detailing your home's value as well as a comparison with similar homes in the area
Home Values in the Area
Average Home Value in this Area
Purchase History
| Date | Buyer | Sale Price | Title Company |
|---|---|---|---|
| Diebold John A | $349,800 | Royal Land Title Agency Ltd | |
| Lane Larry L | -- | -- |
Source: Public Records
Mortgage History
| Date | Status | Borrower | Loan Amount |
|---|---|---|---|
| Open | Diebold John A | $139,900 | |
| Previous Owner | Lane Larry L | $111,845 |
Source: Public Records
Tax History
| Year | Tax Paid | Tax Assessment Tax Assessment Total Assessment is a certain percentage of the fair market value that is determined by local assessors to be the total taxable value of land and additions on the property. | Land | Improvement |
|---|---|---|---|---|
| 2025 | $6,451 | $88,337 | $19,996 | $68,341 |
| 2024 | $5,404 | $88,337 | $19,996 | $68,341 |
| 2023 | $5,508 | $88,337 | $19,996 | $68,341 |
| 2022 | $5,213 | $64,453 | $14,802 | $49,651 |
| 2021 | $5,103 | $64,453 | $14,802 | $49,651 |
| 2020 | $4,720 | $64,453 | $14,802 | $49,651 |
| 2019 | $4,602 | $56,539 | $12,985 | $43,554 |
| 2018 | $4,603 | $56,539 | $12,985 | $43,554 |
| 2017 | $4,381 | $56,539 | $12,985 | $43,554 |
| 2016 | $4,673 | $59,584 | $14,154 | $45,430 |
| 2015 | $4,267 | $59,584 | $14,154 | $45,430 |
| 2014 | $4,268 | $59,584 | $14,154 | $45,430 |
| 2013 | $3,962 | $54,663 | $12,985 | $41,678 |
Source: Public Records
Map
Nearby Homes
- 4050 O'Leary Ave
- 3990 Superior Ave
- 4123 Hoffman Ave
- 7719 Dearborn Ave
- 4025 Deer Park Ave
- 3805 O'Leary Ave
- 7818 Eustis Ct
- 8021 Beech Ave
- 4248 South Ave
- 7873 Gail Dr
- 6829 Alpine Ave
- 13 Wentworth Ln
- 4305 Myrtle Ave
- 34 Wentworth Ln
- 8390 Wexford Ave
- 42 Wentworth Ln
- 5635 Euclid Rd
- 6008 Winnetka Dr
- 4304 Kugler Mill Rd
- 3566 Amberacres Dr
- 7415 Plainfield Rd
- 4052 O Leary Ave
- 4052 O Leary Ave Unit 4056
- 7405 Plainfield Rd
- 4060 Lansdowne Ave
- 4051 O Leary Ave
- 7418 Plainfield Rd
- 7416 Plainfield Rd
- 4056 Lansdowne Ave
- 4049 O'Leary Ave
- 4049 O Leary Ave
- 7414 Plainfield Rd
- 7504 Plainfield Rd
- 4056 O'Leary Ave
- 4050 O Leary Ave
- 4052 Lansdowne Ave
- 7509 Plainfield Rd
- 7408 Plainfield Rd
- 4046 O Leary Ave
- 7506 Plainfield Rd
Your Personal Tour Guide
Ask me questions while you tour the home.