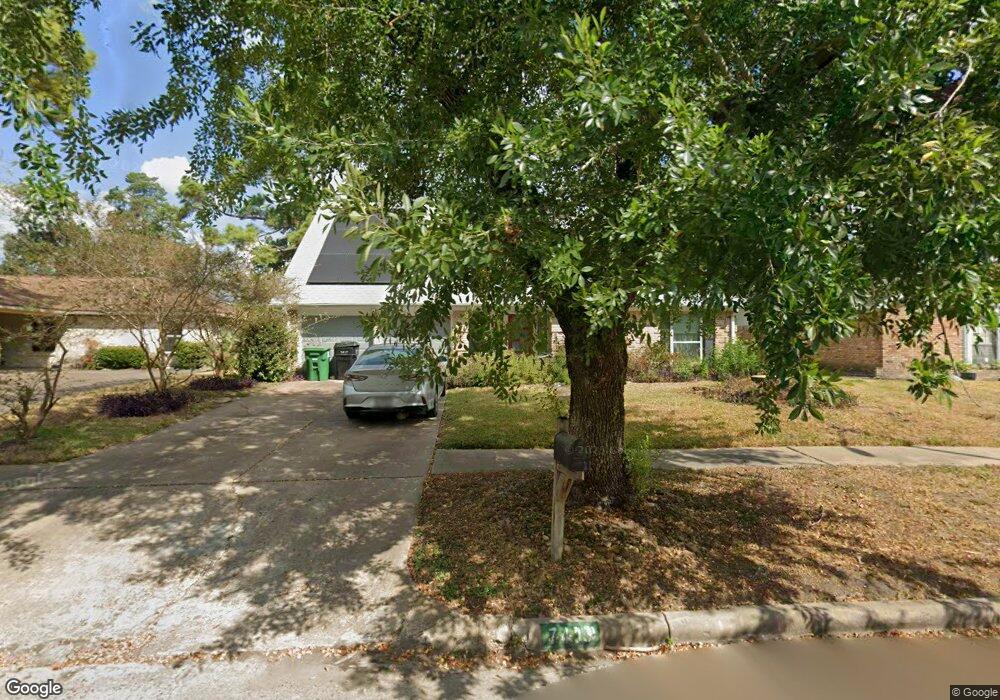
7419 Tall Pines Dr Houston, TX 77088
Greater Inwood NeighborhoodEstimated Value: $241,000 - $265,000
4
Beds
2
Baths
1,945
Sq Ft
$129/Sq Ft
Est. Value
About This Home
This home is located at 7419 Tall Pines Dr, Houston, TX 77088 and is currently estimated at $251,506, approximately $129 per square foot. 7419 Tall Pines Dr is a home located in Harris County with nearby schools including Edward a Vines EC/Pre-K/K School, J. Ruth Smith Elementary, and Hoffman Middle School.
Ownership History
Date
Name
Owned For
Owner Type
Purchase Details
Closed on
Apr 28, 2017
Sold by
Crestar Enterprises Llc
Bought by
Debusk Cara and Bartelt Andrew
Current Estimated Value
Home Financials for this Owner
Home Financials are based on the most recent Mortgage that was taken out on this home.
Original Mortgage
$132,000
Outstanding Balance
$110,163
Interest Rate
4.23%
Mortgage Type
New Conventional
Estimated Equity
$141,343
Purchase Details
Closed on
Jul 28, 2016
Sold by
Dittrick Harris Benny Ross and Dittrick Harris Wendy
Bought by
Crestar Enterprises Llc
Purchase Details
Closed on
Jun 26, 2000
Sold by
Beckham Wallace and Beckham Patricia J
Bought by
Harris Benny Ross and Harris Wendy Dittrick
Home Financials for this Owner
Home Financials are based on the most recent Mortgage that was taken out on this home.
Original Mortgage
$85,600
Interest Rate
8.66%
Create a Home Valuation Report for This Property
The Home Valuation Report is an in-depth analysis detailing your home's value as well as a comparison with similar homes in the area
Home Values in the Area
Average Home Value in this Area
Purchase History
| Date | Buyer | Sale Price | Title Company |
|---|---|---|---|
| Debusk Cara | -- | Texas American Title Co | |
| Crestar Enterprises Llc | -- | First American Title | |
| Harris Benny Ross | -- | -- |
Source: Public Records
Mortgage History
| Date | Status | Borrower | Loan Amount |
|---|---|---|---|
| Open | Debusk Cara | $132,000 | |
| Previous Owner | Harris Benny Ross | $85,600 | |
| Closed | Harris Benny Ross | $21,400 |
Source: Public Records
Tax History Compared to Growth
Tax History
| Year | Tax Paid | Tax Assessment Tax Assessment Total Assessment is a certain percentage of the fair market value that is determined by local assessors to be the total taxable value of land and additions on the property. | Land | Improvement |
|---|---|---|---|---|
| 2025 | $3,819 | $259,470 | $37,879 | $221,591 |
| 2024 | $3,819 | $258,713 | $37,879 | $220,834 |
| 2023 | $3,819 | $258,713 | $37,879 | $220,834 |
| 2022 | $2,894 | $245,931 | $34,436 | $211,495 |
| 2021 | $4,565 | $204,363 | $21,427 | $182,936 |
| 2020 | $4,299 | $187,932 | $21,427 | $166,505 |
| 2019 | $4,097 | $166,729 | $21,427 | $145,302 |
| 2018 | $1,120 | $78,012 | $21,427 | $56,585 |
| 2017 | $3,633 | $136,954 | $21,427 | $115,527 |
| 2016 | $2,480 | $101,833 | $21,427 | $80,406 |
| 2015 | $662 | $96,877 | $13,392 | $83,485 |
| 2014 | $662 | $87,287 | $13,392 | $73,895 |
Source: Public Records
Map
Nearby Homes
- 6918 Bent Branch Dr
- 5907 Darkwood Dr
- 6202 Wagonwheel Cir
- 7606 Victory Dr
- 7211 Deep Forest Dr
- 6931 Wagonwheel Ln
- 5906 Lawn Ln
- 7526 Antoine Dr
- 5914 Lawn Ln
- 0 Maple Hill Dr
- 7146 Bayou Forest Dr
- 6338 Maple Hill Dr
- 4444 Victory Dr Unit 1311
- 4444 Victory Dr Unit 1108
- 5710 Council Grove Ln
- 6310 Silver Chalice Dr
- 6311 Fairwood Dr
- 7218 Jadewood Dr Unit 770
- 7219 Ridge Oak Dr
- 7727 Green Lawn Dr
- 7415 Tall Pines Dr
- 7423 Tall Pines Dr
- 7411 Tall Pines Dr
- 7427 Tall Pines Dr
- 7330 Tall Pines Dr
- 7422 Tall Pines Dr
- 7407 Tall Pines Dr
- 7431 Tall Pines Dr
- 7426 Tall Pines Dr
- 7326 Tall Pines Dr
- 7430 Tall Pines Dr
- 7322 Tall Pines Dr
- 7403 Tall Pines Dr
- 7435 Tall Pines Dr
- 7335 Tall Pines Dr
- 7434 Tall Pines Dr
- 7331 Tall Pines Dr
- 7339 Tall Pines Dr
- 7318 Tall Pines Dr
- 7327 Tall Pines Dr