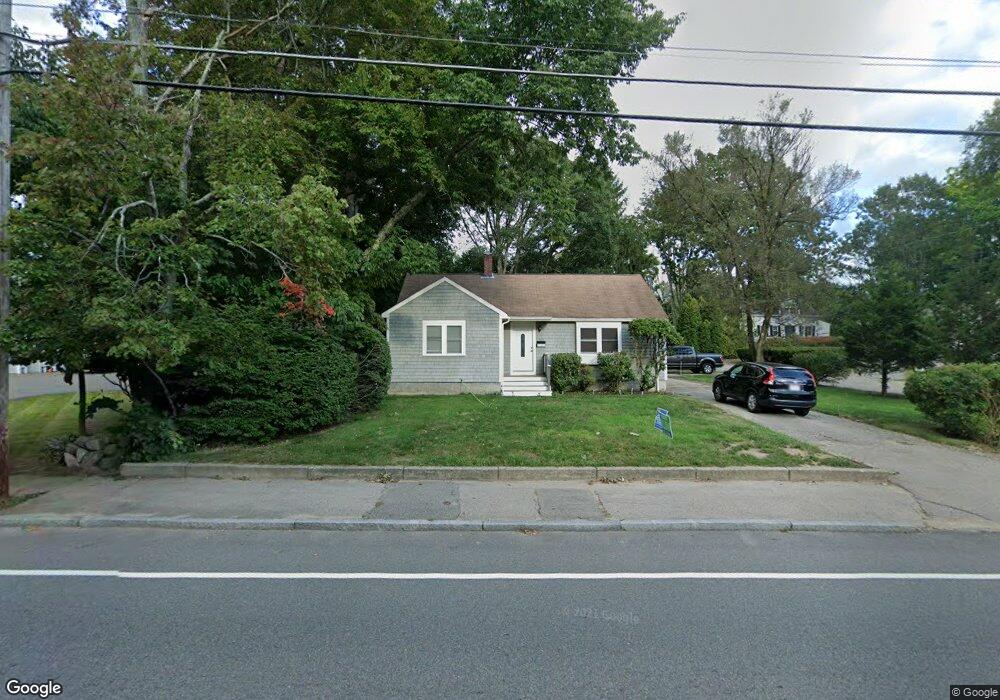
742 Ash St Unit 1 Brockton, MA 02301
Clifton Heights NeighborhoodEstimated Value: $428,000 - $469,000
2
Beds
1
Bath
1,050
Sq Ft
$428/Sq Ft
Est. Value
About This Home
This home is located at 742 Ash St Unit 1, Brockton, MA 02301 and is currently estimated at $449,157, approximately $427 per square foot. 742 Ash St Unit 1 is a home located in Plymouth County with nearby schools including Gilmore Elementary School, John F. Kennedy Elementary School, and Davis K-8 School.
Ownership History
Date
Name
Owned For
Owner Type
Purchase Details
Closed on
Oct 11, 2006
Sold by
Samperi Travis J and Passanisi Peter C
Bought by
Samperi Travis J and Ciri Emily
Current Estimated Value
Purchase Details
Closed on
Mar 31, 2005
Sold by
Donovan James F and Donovan Jamie L
Bought by
Samperi Travis J and Passanisi Peter C
Purchase Details
Closed on
Oct 31, 1997
Sold by
Donovan Shirley F and Mullins Jean M
Bought by
Donovan James F and Donovan Jamie L
Home Financials for this Owner
Home Financials are based on the most recent Mortgage that was taken out on this home.
Original Mortgage
$85,500
Interest Rate
7.31%
Mortgage Type
Purchase Money Mortgage
Create a Home Valuation Report for This Property
The Home Valuation Report is an in-depth analysis detailing your home's value as well as a comparison with similar homes in the area
Home Values in the Area
Average Home Value in this Area
Purchase History
| Date | Buyer | Sale Price | Title Company |
|---|---|---|---|
| Samperi Travis J | -- | -- | |
| Samperi Travis J | $241,400 | -- | |
| Donovan James F | $90,000 | -- |
Source: Public Records
Mortgage History
| Date | Status | Borrower | Loan Amount |
|---|---|---|---|
| Previous Owner | Donovan James F | $85,500 |
Source: Public Records
Tax History Compared to Growth
Tax History
| Year | Tax Paid | Tax Assessment Tax Assessment Total Assessment is a certain percentage of the fair market value that is determined by local assessors to be the total taxable value of land and additions on the property. | Land | Improvement |
|---|---|---|---|---|
| 2025 | $4,252 | $351,100 | $151,300 | $199,800 |
| 2024 | $4,176 | $347,400 | $151,300 | $196,100 |
| 2023 | $4,460 | $343,600 | $116,700 | $226,900 |
| 2022 | $4,160 | $297,800 | $106,300 | $191,500 |
| 2021 | $3,782 | $260,800 | $99,000 | $161,800 |
| 2020 | $3,886 | $256,500 | $94,800 | $161,700 |
| 2019 | $3,887 | $250,100 | $88,700 | $161,400 |
| 2018 | $2,993 | $226,600 | $88,700 | $137,900 |
| 2017 | $2,993 | $185,900 | $88,700 | $97,200 |
| 2016 | $3,246 | $187,000 | $80,600 | $106,400 |
| 2015 | $2,971 | $163,700 | $80,600 | $83,100 |
| 2014 | $2,995 | $165,200 | $80,600 | $84,600 |
Source: Public Records
Map
Nearby Homes