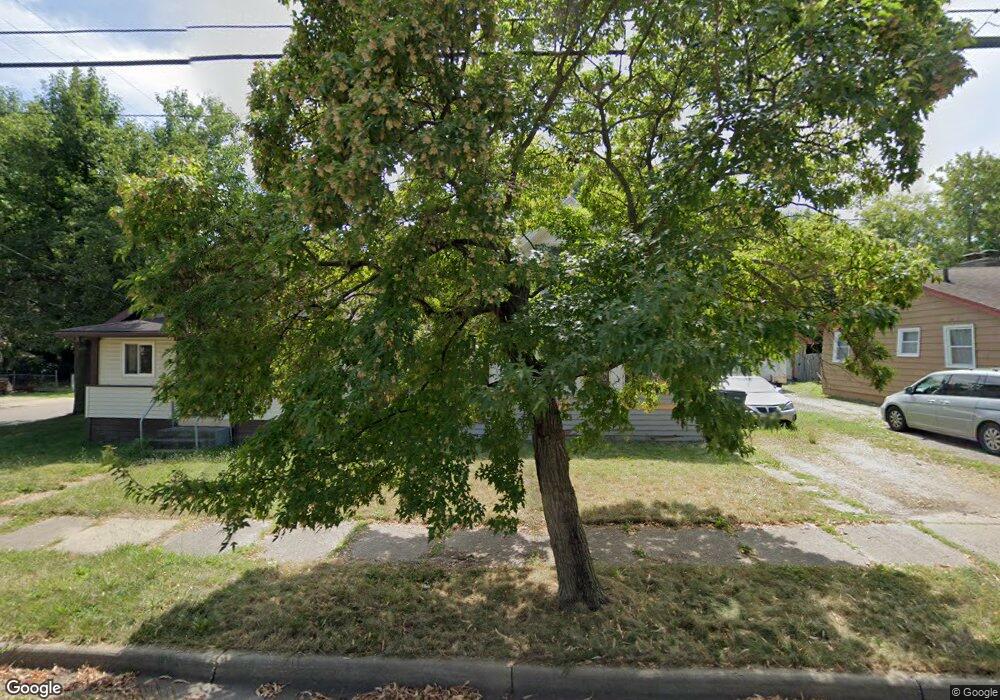
742 Call St Lansing, MI 48906
Northside Lansing NeighborhoodEstimated Value: $94,000 - $124,000
4
Beds
2
Baths
1,002
Sq Ft
$111/Sq Ft
Est. Value
About This Home
This home is located at 742 Call St, Lansing, MI 48906 and is currently estimated at $111,121, approximately $110 per square foot. 742 Call St is a home located in Ingham County with nearby schools including Gier Park School, Pattengill Academy, and Eastern High School.
Ownership History
Date
Name
Owned For
Owner Type
Purchase Details
Closed on
Jun 30, 2021
Sold by
Babcock Jonathon and Babcock Jonathon D
Bought by
Havens Bryan
Current Estimated Value
Purchase Details
Closed on
Sep 28, 2006
Sold by
Hud
Bought by
Babcock Jonathon and Babcock Jonathon D
Home Financials for this Owner
Home Financials are based on the most recent Mortgage that was taken out on this home.
Original Mortgage
$40,000
Interest Rate
6.87%
Mortgage Type
New Conventional
Purchase Details
Closed on
Feb 25, 2006
Sold by
Chase Home Finance Llc
Bought by
Hud
Purchase Details
Closed on
Sep 1, 2005
Sold by
Bente Kristi and Bente Reed W
Bought by
Chase Home Finance Llc
Purchase Details
Closed on
Jul 10, 2000
Sold by
Fager Wayne E and Fager Raye Lynn
Bought by
Bente Kristi L
Home Financials for this Owner
Home Financials are based on the most recent Mortgage that was taken out on this home.
Original Mortgage
$58,969
Interest Rate
8.31%
Mortgage Type
FHA
Create a Home Valuation Report for This Property
The Home Valuation Report is an in-depth analysis detailing your home's value as well as a comparison with similar homes in the area
Home Values in the Area
Average Home Value in this Area
Purchase History
We collect this data history from publicly available records. To have your information removed, we recommend requesting removal directly through your county’s website.
| Date | Buyer | Sale Price | Title Company |
|---|---|---|---|
| Havens Bryan | $35,000 | Transnation Title Agency | |
| Babcock Jonathon | $50,000 | Fatic | |
| Hud | -- | None Available | |
| Chase Home Finance Llc | $65,320 | None Available | |
| Bente Kristi L | $59,000 | -- |
Source: Public Records
Mortgage History
We collect this data history from publicly available records. To have your information removed, we recommend requesting removal directly through your county’s website.
| Date | Status | Borrower | Loan Amount |
|---|---|---|---|
| Previous Owner | Babcock Jonathon | $40,000 | |
| Previous Owner | Bente Kristi L | $58,969 |
Source: Public Records
Tax History
| Year | Tax Paid | Tax Assessment Tax Assessment Total Assessment is a certain percentage of the fair market value that is determined by local assessors to be the total taxable value of land and additions on the property. | Land | Improvement |
|---|---|---|---|---|
| 2025 | $2,923 | $48,600 | $5,700 | $42,900 |
| 2024 | $28 | $44,100 | $5,700 | $38,400 |
| 2023 | $3,204 | $39,900 | $5,700 | $34,200 |
| 2022 | $2,924 | $36,800 | $5,100 | $31,700 |
| 2021 | $2,365 | $34,400 | $5,100 | $29,300 |
| 2020 | $1,838 | $32,600 | $5,100 | $27,500 |
| 2019 | $1,768 | $28,300 | $5,100 | $23,200 |
| 2018 | $1,691 | $29,100 | $5,100 | $24,000 |
| 2017 | $1,619 | $29,100 | $5,100 | $24,000 |
| 2016 | $1,548 | $28,600 | $5,100 | $23,500 |
| 2015 | $1,548 | $27,600 | $10,279 | $17,321 |
| 2014 | $1,548 | $27,000 | $10,279 | $16,721 |
Source: Public Records
Map
Nearby Homes
- 840 E Harris St
- 715 Randall St
- 2315 N High St
- 0 Lake Lansing Rd Unit 289258
- 610 Woodbury Ave
- 1810 N High St
- 1913 Vermont Ave
- 1712 New York Ave
- 810 Mckinley St
- 808 Mckinley St
- 232 E Gier St
- 1704 Massachusetts Ave
- 219 E Harris St
- 213 E Thomas St
- 1530 New York Ave
- 712 Sanford St
- 3003 Creston Ave
- 1635 Indiana Ave
- 1710 Indiana Ave
- 2403 Turner St
Your Personal Tour Guide
Ask me questions while you tour the home.