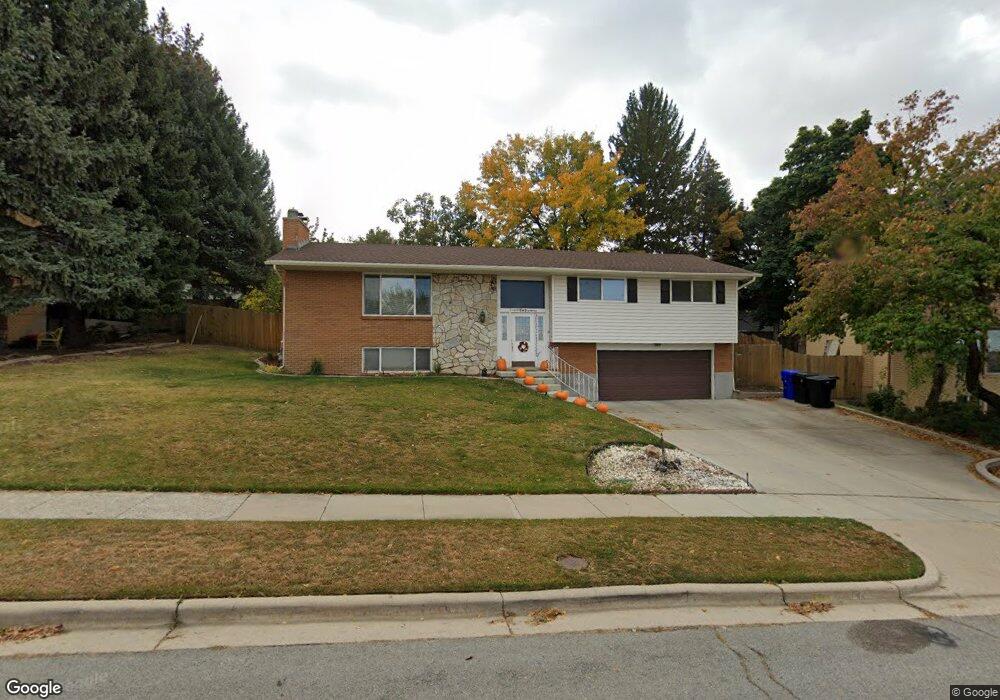
742 Charlene Dr Bountiful, UT 84010
Estimated Value: $554,000 - $582,000
4
Beds
3
Baths
2,200
Sq Ft
$255/Sq Ft
Est. Value
About This Home
This home is located at 742 Charlene Dr, Bountiful, UT 84010 and is currently estimated at $561,651, approximately $255 per square foot. 742 Charlene Dr is a home located in Davis County with nearby schools including Valley View School, Mueller Park Junior High School, and Bountiful High School.
Ownership History
Date
Name
Owned For
Owner Type
Purchase Details
Closed on
Jan 8, 2015
Sold by
Peck Janet B
Bought by
Frazier Jeff W and Frazier Amy M
Current Estimated Value
Purchase Details
Closed on
Nov 13, 2014
Sold by
Hess Haire Janet B and Haire Janet H
Bought by
Peck Janet B
Purchase Details
Closed on
Jan 18, 2013
Sold by
Haire Robert G
Bought by
Haire Janet H
Purchase Details
Closed on
Sep 11, 1996
Sold by
Heso Haire Janet B
Bought by
Haire Robert G and Haire Janet B Heso
Home Financials for this Owner
Home Financials are based on the most recent Mortgage that was taken out on this home.
Original Mortgage
$67,500
Interest Rate
8.33%
Purchase Details
Closed on
Aug 5, 1996
Sold by
Dalby Dean Lamar and Dalby Julie L
Bought by
Hess Haire Janet B
Home Financials for this Owner
Home Financials are based on the most recent Mortgage that was taken out on this home.
Original Mortgage
$67,500
Interest Rate
8.33%
Create a Home Valuation Report for This Property
The Home Valuation Report is an in-depth analysis detailing your home's value as well as a comparison with similar homes in the area
Purchase History
| Date | Buyer | Sale Price | Title Company |
|---|---|---|---|
| Frazier Jeff W | -- | Backman Title Servic | |
| Peck Janet B | -- | Backman Title Serv | |
| Haire Janet H | -- | None Available | |
| Haire Robert G | -- | -- | |
| Hess Haire Janet B | -- | First American Title Co |
Source: Public Records
Mortgage History
| Date | Status | Borrower | Loan Amount |
|---|---|---|---|
| Previous Owner | Hess Haire Janet B | $67,500 |
Source: Public Records
Tax History
| Year | Tax Paid | Tax Assessment Tax Assessment Total Assessment is a certain percentage of the fair market value that is determined by local assessors to be the total taxable value of land and additions on the property. | Land | Improvement |
|---|---|---|---|---|
| 2025 | $3,047 | $276,650 | $134,922 | $141,728 |
| 2024 | $3,292 | $284,899 | $124,483 | $160,416 |
| 2023 | $3,182 | $273,900 | $123,526 | $150,373 |
| 2022 | $3,158 | $517,000 | $217,161 | $299,839 |
| 2021 | $2,768 | $399,000 | $177,425 | $221,575 |
| 2020 | $2,416 | $336,000 | $161,580 | $174,420 |
| 2019 | $2,541 | $334,000 | $161,661 | $172,339 |
| 2018 | $2,175 | $301,000 | $149,833 | $151,167 |
| 2016 | $1,950 | $142,120 | $47,623 | $94,497 |
| 2015 | $1,864 | $132,000 | $47,623 | $84,377 |
| 2014 | -- | $127,295 | $47,623 | $79,672 |
| 2013 | -- | $120,987 | $50,397 | $70,590 |
Source: Public Records
Map
Nearby Homes
- 771 E 1825 S
- 631 E 1700 S
- 795 Abby Ln Unit 5
- 438 E 1800 S
- 1886 S Jeri Dr
- 861 E Millbrook Way
- 1997 S 800 E
- 1087 Arlington Way
- 380 E 1500 S
- 288 E 1650 S
- 626 E 2150 S
- 2059 S 350 E Unit 6
- 2136 Elaine Dr
- 2038 S 350 E Unit 3
- 291 E 1950 S
- 842 E 2150 S
- 2046 S 350 E Unit 4
- 257 E 2050 S
- 320 E 2100 S
- 141 E 1650 S
- 742 E Charlene Way
- 722 Charlene Dr
- 760 Charlene Dr
- 771 Emerald Hills Dr
- 751 Emerald Hills Dr
- 789 Emerald Hills Dr
- 1645 S Davis Blvd
- 2278 E Emerald Hills Dr
- 743 Charlene Dr
- 1643 Charlene Dr
- 1651 S Davis Blvd
- 725 Emerald Hills Dr
- 799 Emerald Hills Dr
- 1673 S Davis Blvd
- 1624 Charlene Dr
- 1631 S Davis Blvd
- 703 Emerald Hills Dr
- 1627 Charlene Dr
- 788 Emerald Hills Dr
- 748 Emerald Hills Dr
Your Personal Tour Guide
Ask me questions while you tour the home.