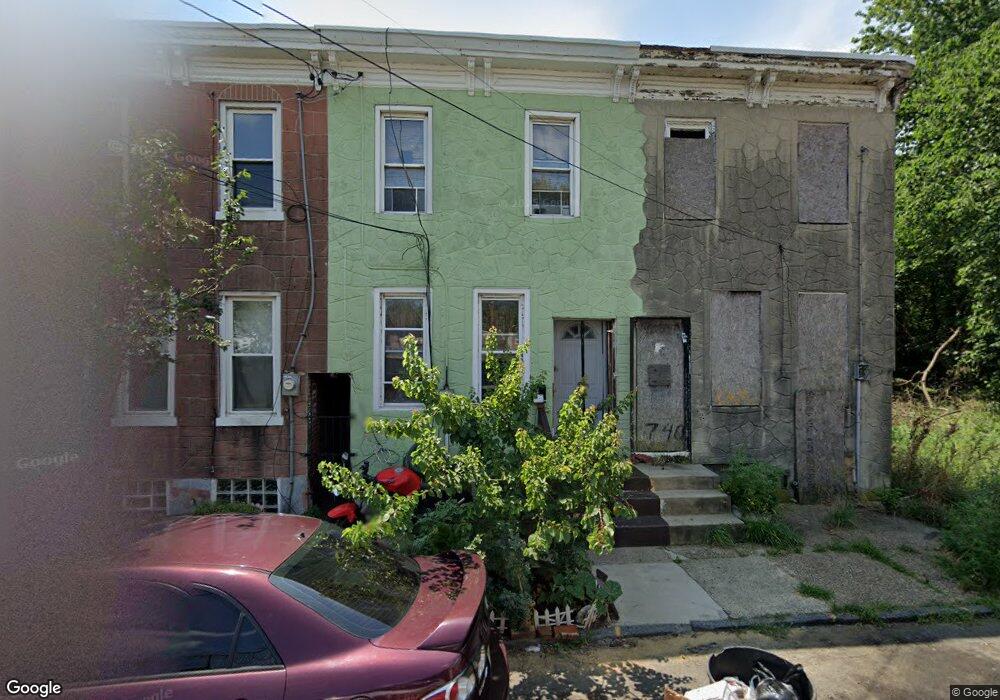
742 Cherry St Camden, NJ 08103
Bergen Square NeighborhoodEstimated Value: $79,717 - $139,000
2
Beds
1
Bath
1,200
Sq Ft
$90/Sq Ft
Est. Value
About This Home
This home is located at 742 Cherry St, Camden, NJ 08103 and is currently estimated at $107,429, approximately $89 per square foot. 742 Cherry St is a home located in Camden County with nearby schools including Camden High School, Hope Community Charter School, and Freedom Prep Charter School.
Ownership History
Date
Name
Owned For
Owner Type
Purchase Details
Closed on
Sep 16, 2022
Sold by
Pinnacle Investment Properties Llc
Bought by
Jander Valentin
Current Estimated Value
Purchase Details
Closed on
Nov 13, 2018
Sold by
Lopez Ruiz Luz Stella Lopez and Lopez Stella Luz Stella
Bought by
Pinnacle Investment Properties Llc
Purchase Details
Closed on
Oct 12, 2009
Sold by
Deutsche Bank National Trust Co
Bought by
Ruiz Andrez and Lopez Luz Stella
Purchase Details
Closed on
Dec 17, 2008
Sold by
Battle Michael A
Bought by
Deutsche Bank National Trust Co
Create a Home Valuation Report for This Property
The Home Valuation Report is an in-depth analysis detailing your home's value as well as a comparison with similar homes in the area
Home Values in the Area
Average Home Value in this Area
Purchase History
| Date | Buyer | Sale Price | Title Company |
|---|---|---|---|
| Jander Valentin | -- | -- | |
| Valentin Jander | -- | None Listed On Document | |
| Pinnacle Investment Properties Llc | -- | Homestead Title Agency | |
| Ruiz Andrez | $19,500 | -- | |
| Deutsche Bank National Trust Co | $37,591 | -- |
Source: Public Records
Tax History Compared to Growth
Tax History
| Year | Tax Paid | Tax Assessment Tax Assessment Total Assessment is a certain percentage of the fair market value that is determined by local assessors to be the total taxable value of land and additions on the property. | Land | Improvement |
|---|---|---|---|---|
| 2025 | $638 | $18,000 | $5,700 | $12,300 |
| 2024 | $617 | $18,000 | $5,700 | $12,300 |
| 2023 | $617 | $18,000 | $5,700 | $12,300 |
| 2022 | $605 | $18,000 | $5,700 | $12,300 |
| 2021 | $603 | $18,000 | $5,700 | $12,300 |
| 2020 | $572 | $18,000 | $5,700 | $12,300 |
| 2019 | $548 | $18,000 | $5,700 | $12,300 |
| 2018 | $545 | $18,000 | $5,700 | $12,300 |
| 2017 | $532 | $18,000 | $5,700 | $12,300 |
| 2016 | $515 | $18,000 | $5,700 | $12,300 |
| 2015 | $496 | $18,000 | $5,700 | $12,300 |
| 2014 | $484 | $18,000 | $5,700 | $12,300 |
Source: Public Records
Map
Nearby Homes
- 917 S 8th St
- 724 Spruce St
- 718 Spruce St
- 836 S 8th St
- 764 Mount Vernon St
- 751 Chestnut St
- 819 Princeton Ave
- 634 Walnut St
- 746 Pine St
- 813 S 9th St
- 803 Princeton Ave
- 780-788 Sycamore St
- 810 S 6th St
- 809 S 6th St
- 1020 Ramona Gonzalez St
- 1020 Spruce St
- 637 637 Royden
- 608 Sycamore St
- 507 Newton Ave
- 611 Saint John St