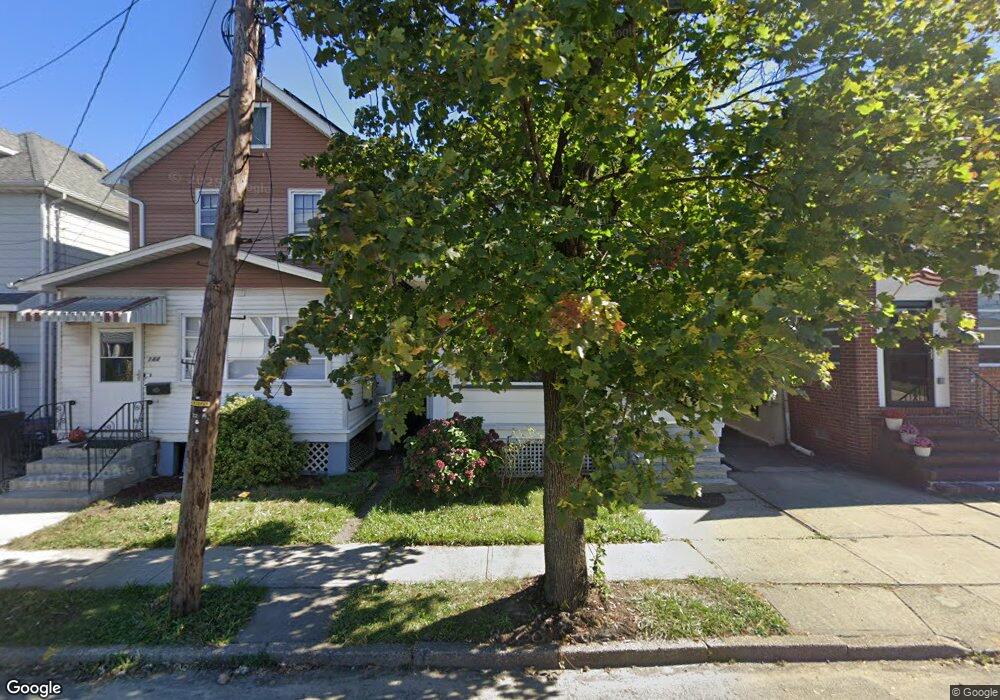
742 Lee St Perth Amboy, NJ 08861
Chickentown NeighborhoodEstimated Value: $343,000 - $418,000
--
Bed
--
Bath
1,120
Sq Ft
$340/Sq Ft
Est. Value
About This Home
This home is located at 742 Lee St, Perth Amboy, NJ 08861 and is currently estimated at $381,031, approximately $340 per square foot. 742 Lee St is a home located in Middlesex County with nearby schools including Perth Amboy High School, Academy for Urban Leadership Charter School, and Assumption Catholic School.
Ownership History
Date
Name
Owned For
Owner Type
Purchase Details
Closed on
Jul 29, 1997
Sold by
Koch Elenore
Bought by
Velez Jose
Current Estimated Value
Home Financials for this Owner
Home Financials are based on the most recent Mortgage that was taken out on this home.
Original Mortgage
$86,000
Outstanding Balance
$12,845
Interest Rate
7.5%
Estimated Equity
$368,186
Create a Home Valuation Report for This Property
The Home Valuation Report is an in-depth analysis detailing your home's value as well as a comparison with similar homes in the area
Home Values in the Area
Average Home Value in this Area
Purchase History
| Date | Buyer | Sale Price | Title Company |
|---|---|---|---|
| Velez Jose | $90,000 | -- |
Source: Public Records
Mortgage History
| Date | Status | Borrower | Loan Amount |
|---|---|---|---|
| Open | Velez Jose | $86,000 |
Source: Public Records
Tax History Compared to Growth
Tax History
| Year | Tax Paid | Tax Assessment Tax Assessment Total Assessment is a certain percentage of the fair market value that is determined by local assessors to be the total taxable value of land and additions on the property. | Land | Improvement |
|---|---|---|---|---|
| 2025 | $6,251 | $207,200 | $112,000 | $95,200 |
| 2024 | $6,239 | $207,200 | $112,000 | $95,200 |
| 2023 | $6,239 | $207,200 | $112,000 | $95,200 |
| 2022 | $6,164 | $207,200 | $112,000 | $95,200 |
| 2021 | $6,172 | $207,200 | $112,000 | $95,200 |
| 2020 | $6,170 | $207,200 | $112,000 | $95,200 |
| 2019 | $6,193 | $207,200 | $112,000 | $95,200 |
| 2018 | $6,139 | $207,200 | $112,000 | $95,200 |
| 2017 | $6,127 | $207,200 | $112,000 | $95,200 |
| 2016 | $5,967 | $207,200 | $112,000 | $95,200 |
| 2015 | $6,009 | $207,200 | $112,000 | $95,200 |
| 2014 | $6,046 | $207,200 | $112,000 | $95,200 |
Source: Public Records
Map
Nearby Homes