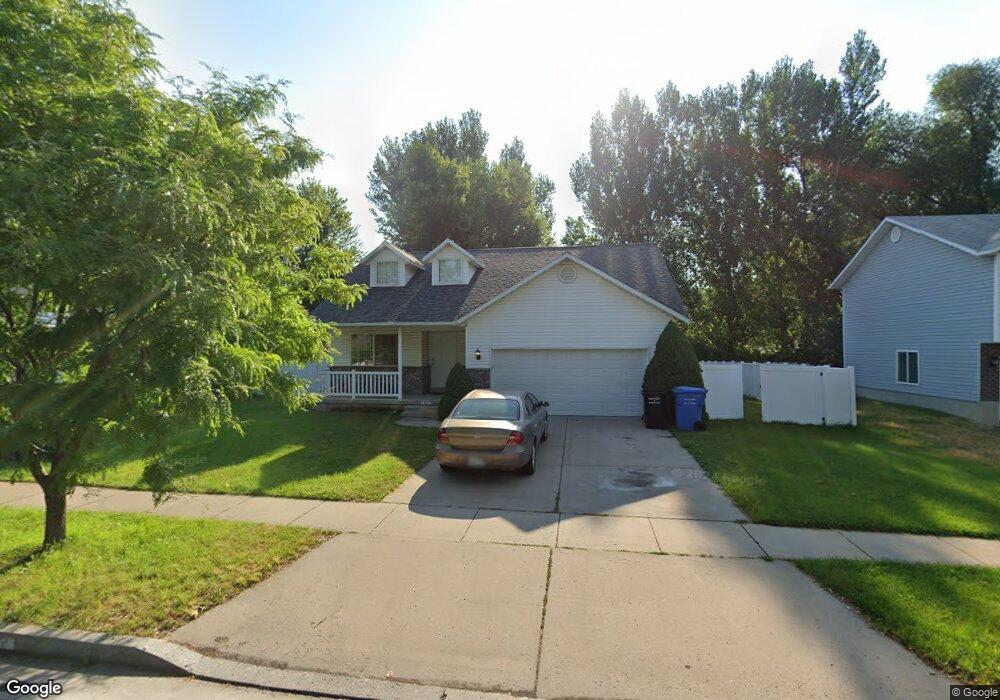
742 Majestic Dr Logan, UT 84321
Woodruff NeighborhoodEstimated Value: $376,000 - $410,000
3
Beds
2
Baths
1,651
Sq Ft
$236/Sq Ft
Est. Value
About This Home
This home is located at 742 Majestic Dr, Logan, UT 84321 and is currently estimated at $389,313, approximately $235 per square foot. 742 Majestic Dr is a home located in Cache County with nearby schools including Woodruff School, Mount Logan Middle School, and Logan High School.
Ownership History
Date
Name
Owned For
Owner Type
Purchase Details
Closed on
Dec 19, 2019
Sold by
Haycock Family Limited Partnership
Bought by
Christensen Rex and Christensen Marie
Current Estimated Value
Purchase Details
Closed on
Jul 3, 2018
Sold by
Coleman Rose and Coleman Chad J
Bought by
Haycock Family Limited Patership
Purchase Details
Closed on
Jan 29, 2016
Sold by
Coleman Rose
Bought by
Coleman Rose and Coleman Chad J
Home Financials for this Owner
Home Financials are based on the most recent Mortgage that was taken out on this home.
Original Mortgage
$153,373
Interest Rate
3.75%
Mortgage Type
FHA
Purchase Details
Closed on
Jun 2, 2009
Sold by
Coleman Rose
Bought by
Coleman Rose and Coleman Chad J
Home Financials for this Owner
Home Financials are based on the most recent Mortgage that was taken out on this home.
Original Mortgage
$170,077
Interest Rate
4.78%
Mortgage Type
FHA
Create a Home Valuation Report for This Property
The Home Valuation Report is an in-depth analysis detailing your home's value as well as a comparison with similar homes in the area
Home Values in the Area
Average Home Value in this Area
Purchase History
| Date | Buyer | Sale Price | Title Company |
|---|---|---|---|
| Christensen Rex | -- | None Available | |
| Haycock Family Limited Patership | -- | Hickman Land Title Company | |
| Coleman Rose | -- | Hickman Land Title Company | |
| Coleman Rose | -- | Hickman Land Title Company | |
| Coleman Rose | -- | Northern Title Company |
Source: Public Records
Mortgage History
| Date | Status | Borrower | Loan Amount |
|---|---|---|---|
| Previous Owner | Coleman Rose | $153,373 | |
| Previous Owner | Coleman Rose | $170,077 |
Source: Public Records
Tax History Compared to Growth
Tax History
| Year | Tax Paid | Tax Assessment Tax Assessment Total Assessment is a certain percentage of the fair market value that is determined by local assessors to be the total taxable value of land and additions on the property. | Land | Improvement |
|---|---|---|---|---|
| 2025 | $1,559 | $201,690 | $0 | $0 |
| 2024 | $1,612 | $201,970 | $0 | $0 |
| 2023 | $1,667 | $199,015 | $0 | $0 |
| 2022 | $1,504 | $167,660 | $0 | $0 |
| 2021 | $1,466 | $252,475 | $43,000 | $209,475 |
| 2020 | $1,309 | $202,896 | $43,000 | $159,896 |
| 2019 | $1,368 | $202,896 | $43,000 | $159,896 |
| 2018 | $1,344 | $182,040 | $43,000 | $139,040 |
| 2017 | $1,251 | $89,595 | $0 | $0 |
| 2016 | $1,297 | $89,595 | $0 | $0 |
| 2015 | $1,084 | $74,780 | $0 | $0 |
| 2014 | $980 | $74,780 | $0 | $0 |
| 2013 | -- | $74,780 | $0 | $0 |
Source: Public Records
Map
Nearby Homes
- 736 Majestic Dr
- 985 W 720 S
- 553 Center Ave
- 501 Southwest St
- 2399 W 430 S Unit 33
- 1220 W 575 S
- 658 W 500 S
- 1099 Three Pointe Ave
- 548 S 1225 W Unit 115
- 542 S 1225 W Unit 116
- 518 S 1225 W
- 506 S 1225 W
- 1239 W 575 S Unit 152
- 1239 W 575 S
- Redwood Plan at Rivergate - Logan
- Madison Plan at Rivergate - Logan
- Sitka Plan at Sugar Creek - Logan (Townhomes)
- Hawthorne Plan at Rivergate - Logan
- Springhill Plan at Rivergate - Logan
- Auburn Plan at Rivergate - Logan
- 754 Majestic Dr Unit 21
- 90 Crayon Ct
- 80 Crayon Ct
- 728 Majestic Dr
- 741 Majestic Dr
- 753 Majestic Dr
- 70 Crayon Ct
- 733 Majestic Dr
- 720 Majestic Dr
- 20 Crayon Ct Unit 50
- 20 Crayon Ct
- 725 Majestic Dr
- 50 Crayon Ct
- 962 Rainbow Dr
- 770 S 980 W
- 105 Crayon Ct Unit 44
- 105 Crayon Ct
- 792 S 980 W
- 762 S 980 W
- 952 W 720 S