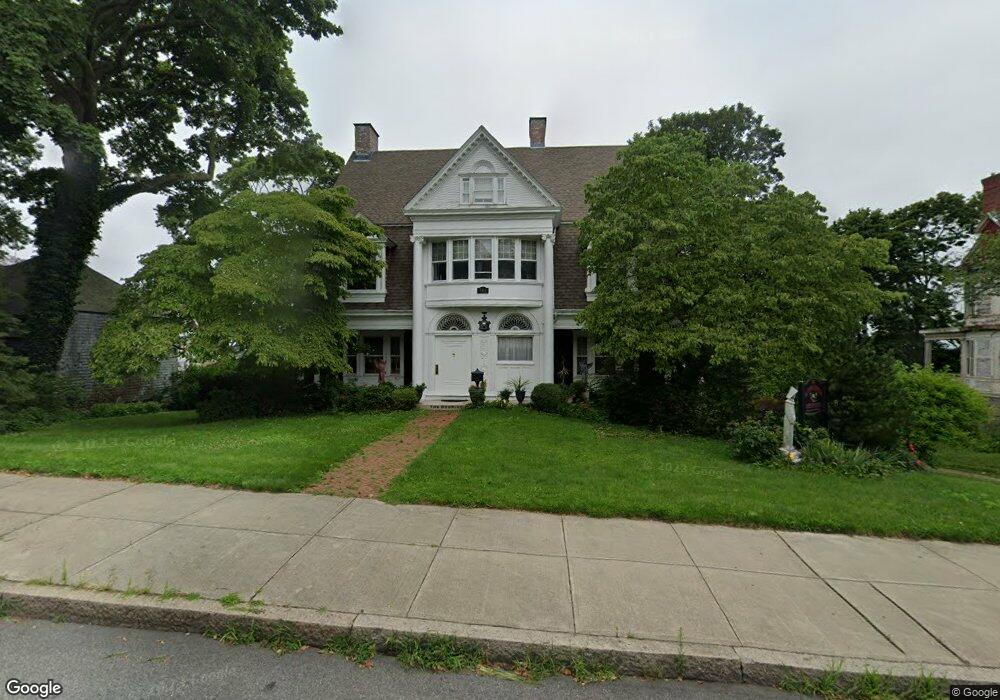
742 Rock St Fall River, MA 02720
Lower Highlands NeighborhoodEstimated Value: $543,000 - $939,000
7
Beds
4
Baths
4,623
Sq Ft
$155/Sq Ft
Est. Value
About This Home
This home is located at 742 Rock St, Fall River, MA 02720 and is currently estimated at $715,440, approximately $154 per square foot. 742 Rock St is a home located in Bristol County with nearby schools including Mary Fonseca Elementary School, Morton Middle School, and B M C Durfee High School.
Ownership History
Date
Name
Owned For
Owner Type
Purchase Details
Closed on
Oct 26, 2010
Sold by
Lavoie Susan B
Bought by
Spearin Michael P and Kershaw Scott D
Current Estimated Value
Home Financials for this Owner
Home Financials are based on the most recent Mortgage that was taken out on this home.
Original Mortgage
$314,500
Outstanding Balance
$207,748
Interest Rate
4.37%
Mortgage Type
Purchase Money Mortgage
Estimated Equity
$507,692
Create a Home Valuation Report for This Property
The Home Valuation Report is an in-depth analysis detailing your home's value as well as a comparison with similar homes in the area
Home Values in the Area
Average Home Value in this Area
Purchase History
| Date | Buyer | Sale Price | Title Company |
|---|---|---|---|
| Spearin Michael P | $370,000 | -- |
Source: Public Records
Mortgage History
| Date | Status | Borrower | Loan Amount |
|---|---|---|---|
| Open | Spearin Michael P | $314,500 |
Source: Public Records
Tax History
| Year | Tax Paid | Tax Assessment Tax Assessment Total Assessment is a certain percentage of the fair market value that is determined by local assessors to be the total taxable value of land and additions on the property. | Land | Improvement |
|---|---|---|---|---|
| 2025 | $7,084 | $618,700 | $126,800 | $491,900 |
| 2024 | $6,635 | $577,500 | $124,300 | $453,200 |
| 2023 | $6,913 | $563,400 | $112,000 | $451,400 |
| 2022 | $6,117 | $484,700 | $105,700 | $379,000 |
| 2021 | $5,907 | $427,100 | $100,900 | $326,200 |
| 2020 | $5,809 | $402,000 | $96,300 | $305,700 |
| 2019 | $5,759 | $395,000 | $100,700 | $294,300 |
| 2018 | $5,595 | $382,700 | $99,100 | $283,600 |
| 2017 | $5,292 | $378,000 | $99,100 | $278,900 |
| 2016 | $5,024 | $368,600 | $104,300 | $264,300 |
| 2015 | $4,821 | $368,600 | $104,300 | $264,300 |
| 2014 | $4,637 | $368,600 | $104,300 | $264,300 |
Source: Public Records
Map
Nearby Homes
- 267 Lincoln Ave
- 889 High St
- 909 High St Unit 1
- 11 Dyer St
- 72 Belmont St
- 575 N Main St
- 327 Brownell St
- 750 Davol St Unit 1012
- 750 Davol St Unit 219
- 750 Davol St Unit 221
- 750 Davol St Unit 616
- 750 Davol St Unit 214
- 450 Rock St Unit 1
- 33-35 Malvey St
- 503 Highland Ave
- 499 Maple St
- 10 N Court St Unit 3
- 339 Danforth St Unit 6
- 337 Danforth St Unit 7
- 126 June St
- 764 Rock St
- 764 Rock St Unit 2
- 764 Rock St Unit 2A
- 764 Rock St Unit ROCK STREET 2NORTH
- 764 Rock St Unit 2s
- 764 Rock St Unit 3
- 132 French St
- 473 June St
- 483 June St
- 497 June St
- 710 Rock St
- 710 Rock St Unit 3
- 710 Rock St Unit 1
- 457 June St
- 739 Rock St
- 739 Rock St Unit 1F
- 739 Rock St Unit 3
- 753 Rock St
- 782 Rock St
- 507 June St
Your Personal Tour Guide
Ask me questions while you tour the home.