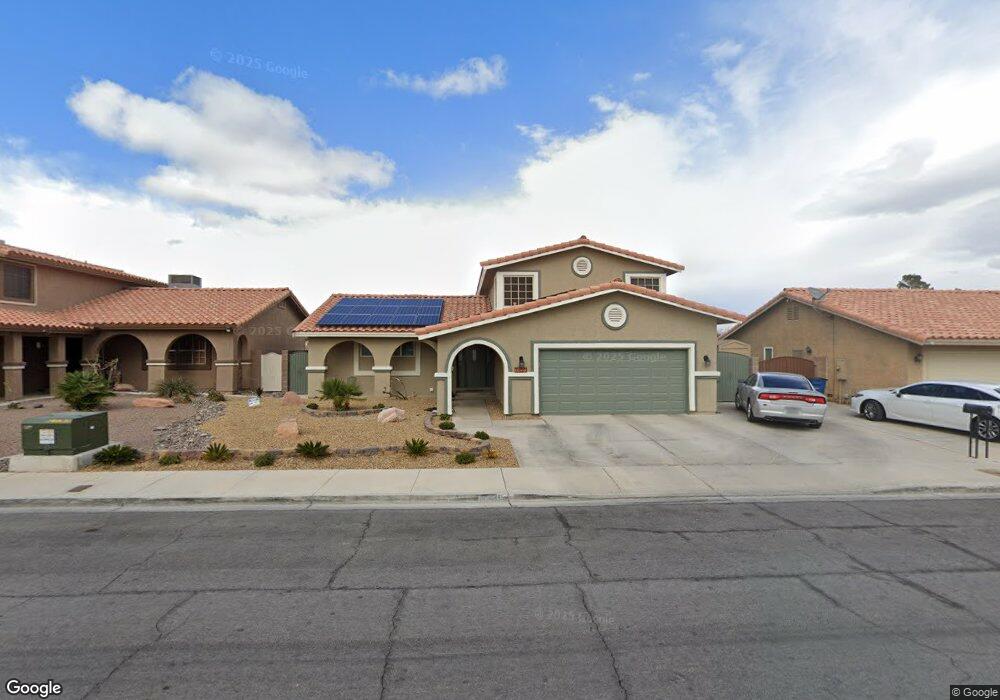
7420 W Gilmore Ave Las Vegas, NV 89129
Lone Mountain NeighborhoodEstimated Value: $493,000 - $556,000
4
Beds
3
Baths
2,167
Sq Ft
$244/Sq Ft
Est. Value
About This Home
This home is located at 7420 W Gilmore Ave, Las Vegas, NV 89129 and is currently estimated at $529,154, approximately $244 per square foot. 7420 W Gilmore Ave is a home located in Clark County with nearby schools including Marc Kahre Elementary School, Dorothy Eisenberg Elementary School, and Irwin & Susan Molasky Junior High School.
Ownership History
Date
Name
Owned For
Owner Type
Purchase Details
Closed on
Mar 9, 2021
Sold by
Leeming Joseph P and Leeming Annette I
Bought by
Joseph P Leeming And Annette I Leeming Revoca and Leeming
Current Estimated Value
Create a Home Valuation Report for This Property
The Home Valuation Report is an in-depth analysis detailing your home's value as well as a comparison with similar homes in the area
Home Values in the Area
Average Home Value in this Area
Purchase History
| Date | Buyer | Sale Price | Title Company |
|---|---|---|---|
| Joseph P Leeming And Annette I Leeming Revoca | -- | None Listed On Document |
Source: Public Records
Tax History Compared to Growth
Tax History
| Year | Tax Paid | Tax Assessment Tax Assessment Total Assessment is a certain percentage of the fair market value that is determined by local assessors to be the total taxable value of land and additions on the property. | Land | Improvement |
|---|---|---|---|---|
| 2025 | $2,560 | $116,979 | $38,850 | $78,129 |
| 2024 | $2,486 | $116,979 | $38,850 | $78,129 |
| 2023 | $2,486 | $109,654 | $35,350 | $74,304 |
| 2022 | $2,647 | $97,538 | $29,050 | $68,488 |
| 2021 | $2,451 | $91,526 | $26,250 | $65,276 |
| 2020 | $2,273 | $91,218 | $26,250 | $64,968 |
| 2019 | $2,130 | $89,142 | $24,850 | $64,292 |
| 2018 | $2,032 | $82,982 | $21,000 | $61,982 |
| 2017 | $2,620 | $79,930 | $16,800 | $63,130 |
| 2016 | $1,903 | $78,412 | $15,050 | $63,362 |
| 2015 | $1,899 | $68,186 | $11,550 | $56,636 |
| 2014 | $1,843 | $57,515 | $8,750 | $48,765 |
Source: Public Records
Map
Nearby Homes
- 7415 Constantinople Ave
- 7545 Constantinople Ave
- 3801 Bessemer Ct
- 3641 White Plains Dr
- 7609 Rory Ct
- 7504 Grenfell Dr
- 7412 Summer Crest Ln
- 7408 Summer Crest Ln
- 7524 Summer Crest Ln
- 7405 Blue Sage Ct
- 3890 Quadrel St
- 4004 Featherstone Ln
- 4021 Sea Hero St Unit 1
- 7633 Winterthur Ct
- 4025 Sea Hero St
- 4025 Cunning Fellow Ct
- 3560 Unique Way
- 7317 Wild Roar Ave
- 3553 Unique Way
- 7737 Prosperity River Ave
- 7416 W Gilmore Ave
- 7424 W Gilmore Ave
- 7421 W Gilmore Ave
- 7425 W Gilmore Ave
- 7417 W Gilmore Ave
- 7408 W Gilmore Ave
- 7432 W Gilmore Ave
- 7429 W Gilmore Ave
- 7413 W Gilmore Ave
- 7435 Constantinople Ave
- 7433 W Gilmore Ave
- 7500 W Gilmore Ave
- 7404 W Gilmore Ave
- 7409 W Gilmore Ave
- 7416 Fort Wilkins Dr
- 7420 Fort Wilkins Dr
- 7412 Fort Wilkins Dr
- 7424 Fort Wilkins Dr
- 7408 Fort Wilkins Dr