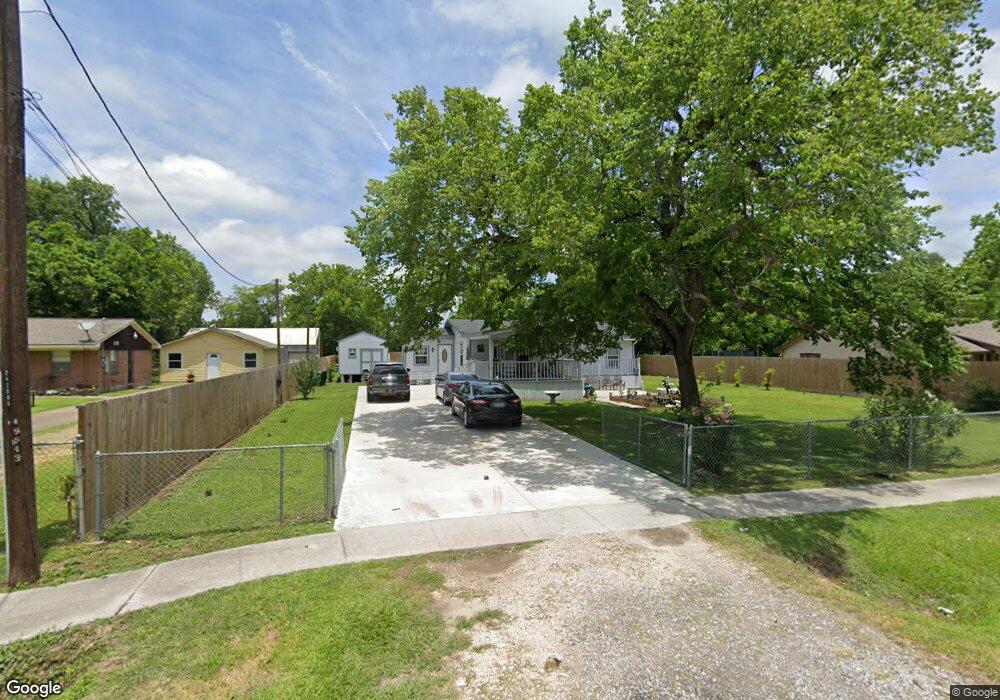
7421 Jay St Houston, TX 77028
Trinity-Houston Gardens NeighborhoodEstimated Value: $181,204 - $239,000
3
Beds
1
Bath
1,320
Sq Ft
$150/Sq Ft
Est. Value
About This Home
This home is located at 7421 Jay St, Houston, TX 77028 and is currently estimated at $198,051, approximately $150 per square foot. 7421 Jay St is a home located in Harris County with nearby schools including McGowen Elementary School, Key Middle, and Kashmere High School.
Ownership History
Date
Name
Owned For
Owner Type
Purchase Details
Closed on
May 17, 2017
Sold by
Justus Marian
Bought by
Perez Eduardo R and Perez Enriqueta F
Current Estimated Value
Home Financials for this Owner
Home Financials are based on the most recent Mortgage that was taken out on this home.
Original Mortgage
$40,000
Interest Rate
4.02%
Mortgage Type
New Conventional
Purchase Details
Closed on
Jan 5, 2017
Sold by
The Nationsro Hecm Acquistiontu
Bought by
Natop Properties Inc
Purchase Details
Closed on
Aug 1, 2016
Sold by
Collins Theo
Bought by
Perez Eduardo R and Perez Enriqueta F
Home Financials for this Owner
Home Financials are based on the most recent Mortgage that was taken out on this home.
Original Mortgage
$85,000
Interest Rate
3.56%
Mortgage Type
New Conventional
Purchase Details
Closed on
Dec 2, 1997
Sold by
Inkley Luther Murden and Suzanne Inkley E
Bought by
Smith Jewel Lee
Purchase Details
Closed on
Oct 18, 1994
Sold by
Abrams John H
Bought by
Anson Financial Inc
Create a Home Valuation Report for This Property
The Home Valuation Report is an in-depth analysis detailing your home's value as well as a comparison with similar homes in the area
Home Values in the Area
Average Home Value in this Area
Purchase History
| Date | Buyer | Sale Price | Title Company |
|---|---|---|---|
| Perez Eduardo R | -- | None Available | |
| Natop Properties Inc | -- | None Available | |
| Perez Eduardo R | -- | None Available | |
| Smith Jewel Lee | -- | -- | |
| Anson Financial Inc | -- | Chicago Title |
Source: Public Records
Mortgage History
| Date | Status | Borrower | Loan Amount |
|---|---|---|---|
| Previous Owner | Perez Eduardo R | $40,000 | |
| Previous Owner | Perez Eduardo R | $85,000 |
Source: Public Records
Tax History Compared to Growth
Tax History
| Year | Tax Paid | Tax Assessment Tax Assessment Total Assessment is a certain percentage of the fair market value that is determined by local assessors to be the total taxable value of land and additions on the property. | Land | Improvement |
|---|---|---|---|---|
| 2025 | $3,001 | $213,371 | $99,300 | $114,071 |
| 2024 | $3,001 | $146,347 | $99,300 | $47,047 |
| 2023 | $3,001 | $119,526 | $74,475 | $45,051 |
| 2022 | $1,922 | $87,282 | $46,175 | $41,107 |
| 2021 | $1,404 | $60,222 | $16,931 | $43,291 |
| 2020 | $1,458 | $60,222 | $16,931 | $43,291 |
| 2019 | $1,524 | $60,222 | $16,931 | $43,291 |
| 2018 | $531 | $20,979 | $18,205 | $2,774 |
| 2017 | $889 | $35,167 | $18,205 | $16,962 |
| 2016 | $889 | $35,167 | $18,205 | $16,962 |
| 2015 | $790 | $30,749 | $11,585 | $19,164 |
| 2014 | $790 | $30,749 | $11,585 | $19,164 |
Source: Public Records
Map
Nearby Homes
- 0 N Wayside Dr Unit 46613359
- 0 N Wayside Dr Unit 98122285
- 0 N Wayside Dr Unit ACT6956085
- 0 Blue St Unit 50257357
- 6920 Homestead Rd
- 5325 Yarmouth
- 0 N Wayside Dr Unit 54910598
- 0 Balfour Unit 51790448
- 7505 Jay St
- 7123 Saint Louis St
- 0 Kellett St Unit 85066707
- 0 Glen Manor Dr Unit 10745202
- 7337 Howton St
- 7417 Miley St
- 7306 Saint Louis St
- 7337 Miley St
- 7015 Elbert St
- 7713 Saint Louis St
- 0 Saint Louis St
- 7717 Saint Louis St
- 7425 Jay St
- 7417 Jay St
- 7411 Jay St
- 7418 Jay St
- 7426 Jay St
- 6806 Elbert St
- 6808 Elbert St
- 6818 Elbert
- 0 Blue St Unit 66079948
- 0 Balfour Unit 84809693
- 0 Queensland St Unit 62788644
- 0 Queensland St Unit 73591214
- 0 Balfour Unit 21845999
- 0 Balfour Unit 60436182
- 0 Queensland St Unit 14352765
- 0 Howton Unit 16765601
- 0 Balfour Unit 96597039
- 0 Balfour Unit 21732079
- 0 Hoffman St Unit 87621861
- 0 N Wayside Dr Unit 73290815