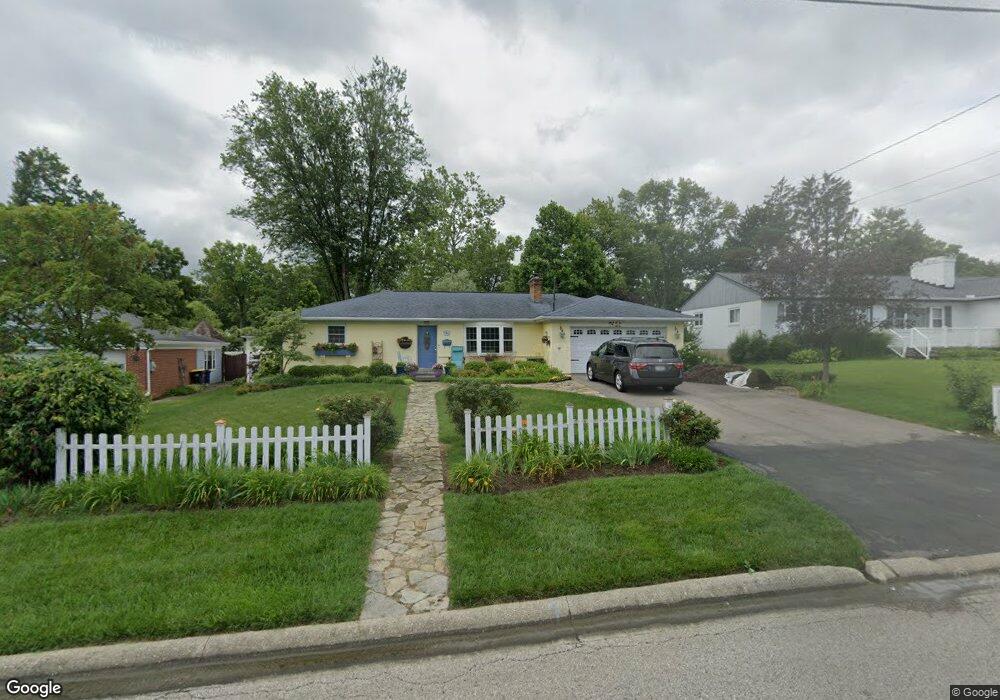
7421 Shewango Way Cincinnati, OH 45243
Estimated Value: $392,683 - $499,000
2
Beds
1
Bath
1,365
Sq Ft
$329/Sq Ft
Est. Value
About This Home
This home is located at 7421 Shewango Way, Cincinnati, OH 45243 and is currently estimated at $449,671, approximately $329 per square foot. 7421 Shewango Way is a home located in Hamilton County with nearby schools including Madeira Elementary School, Madeira Middle School, and Madeira High School.
Ownership History
Date
Name
Owned For
Owner Type
Purchase Details
Closed on
Mar 19, 1996
Sold by
Hoskins Darrell E and Hoskins Lisa H
Bought by
Opichka Jan N and Opichka Joan M
Current Estimated Value
Home Financials for this Owner
Home Financials are based on the most recent Mortgage that was taken out on this home.
Original Mortgage
$106,650
Outstanding Balance
$1,537
Interest Rate
7.91%
Estimated Equity
$448,134
Purchase Details
Closed on
Aug 11, 1995
Sold by
Guard Marcia J and Underwood Marcia J
Bought by
Hoskins Darrell E and Hoskins Lisa H
Home Financials for this Owner
Home Financials are based on the most recent Mortgage that was taken out on this home.
Original Mortgage
$94,000
Interest Rate
7.64%
Purchase Details
Closed on
Dec 9, 1993
Sold by
Malady Jessie V
Bought by
Underwood Marcia J
Create a Home Valuation Report for This Property
The Home Valuation Report is an in-depth analysis detailing your home's value as well as a comparison with similar homes in the area
Home Values in the Area
Average Home Value in this Area
Purchase History
| Date | Buyer | Sale Price | Title Company |
|---|---|---|---|
| Opichka Jan N | $118,500 | -- | |
| Hoskins Darrell E | -- | -- | |
| Underwood Marcia J | -- | -- |
Source: Public Records
Mortgage History
| Date | Status | Borrower | Loan Amount |
|---|---|---|---|
| Open | Opichka Jan N | $106,650 | |
| Previous Owner | Hoskins Darrell E | $94,000 | |
| Closed | Hoskins Darrell E | $20,075 |
Source: Public Records
Tax History
| Year | Tax Paid | Tax Assessment Tax Assessment Total Assessment is a certain percentage of the fair market value that is determined by local assessors to be the total taxable value of land and additions on the property. | Land | Improvement |
|---|---|---|---|---|
| 2025 | $6,653 | $113,110 | $53,256 | $59,854 |
| 2024 | $6,481 | $113,110 | $53,256 | $59,854 |
| 2023 | $6,567 | $113,110 | $53,256 | $59,854 |
| 2022 | $6,203 | $87,340 | $39,764 | $47,576 |
| 2021 | $6,070 | $87,340 | $39,764 | $47,576 |
| 2020 | $5,616 | $87,340 | $39,764 | $47,576 |
| 2019 | $5,434 | $77,984 | $35,504 | $42,480 |
| 2018 | $5,478 | $77,984 | $35,504 | $42,480 |
| 2017 | $5,194 | $77,984 | $35,504 | $42,480 |
| 2016 | $4,747 | $67,208 | $16,552 | $50,656 |
| 2015 | $4,392 | $67,208 | $16,552 | $50,656 |
| 2014 | $4,417 | $67,208 | $16,552 | $50,656 |
| 2013 | $4,539 | $66,542 | $16,387 | $50,155 |
Source: Public Records
Map
Nearby Homes
- 7300 N Mingo Ln
- 7503 S Timberlane Dr
- 7817 Locust Ln
- 7321 Hosbrook Rd
- 7220 Mar Del Dr
- 7159 Hosbrook Rd
- 7231 Berwood Dr
- 7280 E Galbraith Rd
- 7156 Maple Ave
- 7317 Euclid Ave
- 7133 Fowler Ave
- 7925 Spiritwood Ct
- 7334 Iuka Ave
- 7151 Euclid Ave
- 7831 Euclid Ave
- 7845 Euclid Ave
- 7834 Laurel Ave
- 8120 Maxfield Ln
- 7237 Osceola Dr
- 7223 Longfield Dr
- 7411 Shewango Way
- 7431 Shewango Way
- 7401 Shewango Way
- 7420 S Mingo Ln
- 7441 Shewango Way
- 7430 S Mingo Ln
- 7410 S Mingo Ln
- 7410 Shewango Way
- 7420 Shewango Way
- 7440 S Mingo Ln
- 7400 S Mingo Ln
- 7361 Shewango Way
- 7440 Shewango Way
- 7451 Shewango Way
- 7400 Shewango Way
- 7450 Shewango Way
- 7456 S Mingo Ln
- 7380 S Mingo Ln
- 7523 S Mingo Ln
- 7351 Shewango Way
Your Personal Tour Guide
Ask me questions while you tour the home.