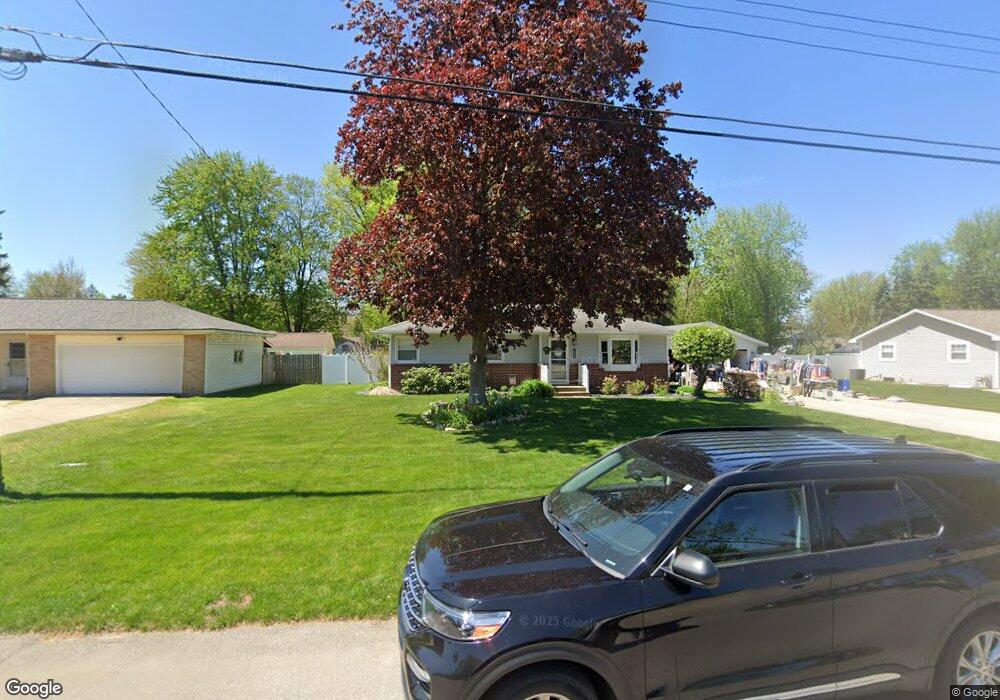
7423 Eastlane Ave Jenison, MI 49428
Estimated Value: $325,000 - $371,000
2
Beds
2
Baths
1,132
Sq Ft
$298/Sq Ft
Est. Value
About This Home
This home is located at 7423 Eastlane Ave, Jenison, MI 49428 and is currently estimated at $336,948, approximately $297 per square foot. 7423 Eastlane Ave is a home located in Ottawa County with nearby schools including Sandy Hill Elementary School, Jenison Junior High School, and Jenison High School.
Ownership History
Date
Name
Owned For
Owner Type
Purchase Details
Closed on
Dec 5, 2006
Sold by
Chase Joshua Allen
Bought by
Chase Carrie Ann
Current Estimated Value
Purchase Details
Closed on
Aug 29, 2003
Sold by
Norder Nathan R and Norder Eliabeth A
Bought by
Chase Joshua and Chase Carrie
Home Financials for this Owner
Home Financials are based on the most recent Mortgage that was taken out on this home.
Original Mortgage
$136,872
Outstanding Balance
$63,233
Interest Rate
6.18%
Mortgage Type
FHA
Estimated Equity
$273,715
Purchase Details
Closed on
Aug 6, 2002
Sold by
Wolf Carrie A and Chase Carrie Ann
Bought by
Chase Carrie A and Wolf Todd W
Home Financials for this Owner
Home Financials are based on the most recent Mortgage that was taken out on this home.
Original Mortgage
$102,500
Interest Rate
3%
Mortgage Type
New Conventional
Create a Home Valuation Report for This Property
The Home Valuation Report is an in-depth analysis detailing your home's value as well as a comparison with similar homes in the area
Home Values in the Area
Average Home Value in this Area
Purchase History
| Date | Buyer | Sale Price | Title Company |
|---|---|---|---|
| Chase Carrie Ann | -- | None Available | |
| Chase Joshua | $138,000 | Lighthouse Title Inc | |
| Chase Carrie A | -- | Title Resource Agency |
Source: Public Records
Mortgage History
| Date | Status | Borrower | Loan Amount |
|---|---|---|---|
| Open | Chase Joshua | $136,872 | |
| Previous Owner | Chase Carrie A | $102,500 |
Source: Public Records
Tax History Compared to Growth
Tax History
| Year | Tax Paid | Tax Assessment Tax Assessment Total Assessment is a certain percentage of the fair market value that is determined by local assessors to be the total taxable value of land and additions on the property. | Land | Improvement |
|---|---|---|---|---|
| 2025 | $2,246 | $152,600 | $0 | $0 |
| 2024 | $1,949 | $140,600 | $0 | $0 |
| 2023 | $1,860 | $123,600 | $0 | $0 |
| 2022 | $1,991 | $104,600 | $0 | $0 |
| 2021 | $1,933 | $96,500 | $0 | $0 |
| 2020 | $1,912 | $91,400 | $0 | $0 |
| 2019 | $1,914 | $87,200 | $0 | $0 |
| 2018 | $1,782 | $81,100 | $0 | $0 |
| 2017 | $1,732 | $77,700 | $0 | $0 |
| 2016 | $1,721 | $69,700 | $0 | $0 |
| 2015 | $1,643 | $64,600 | $0 | $0 |
| 2014 | $1,643 | $64,200 | $0 | $0 |
Source: Public Records
Map
Nearby Homes
- 7444 Pinegrove Dr Unit 59
- 7461 Pinegrove Dr Unit 29
- 7425 Boulder Bluff Dr Unit 112
- 7373 Pinegrove Dr Unit 109
- 7523 Boulder Bluff Dr Unit 82
- 7314 Pinegrove Dr
- 7450 Boulder Bluff Dr Unit 66
- 7450 Boulder Bluff Dr Unit 61
- 7165 Keystone Ct
- 7107 Westwood Dr
- 7342 Cherry Ave
- 1101 Robin St
- 2159 Tyler St
- 3205 Deer Haven Dr
- 7502 22nd Ave
- 2101 Rosewood St
- 1937 Mulberry Ln
- 2194 Oak Hollow Dr
- 7490 N Garden Ct
- 8103 Birchwood Ave
- 7407 Eastlane Ave
- 7424 Westlane Ave
- 7440 Westlane Ave
- 7408 Westlane Ave
- 7391 Eastlane Ave
- 7455 Eastlane Ave
- 7422 Eastlane Ave
- 7402 Eastlane Ave
- 7392 Westlane Ave
- 7456 Westlane Ave
- 7444 Eastlane Ave
- 1609 Miede St
- 7375 Eastlane Ave
- 7471 Eastlane Ave
- 7464 Eastlane Ave
- 7376 Westlane Ave
- 7472 Westlane Ave
- 7427 Astronaut Ave
- 7411 Astronaut Ave
- 7419 Westlane Ave