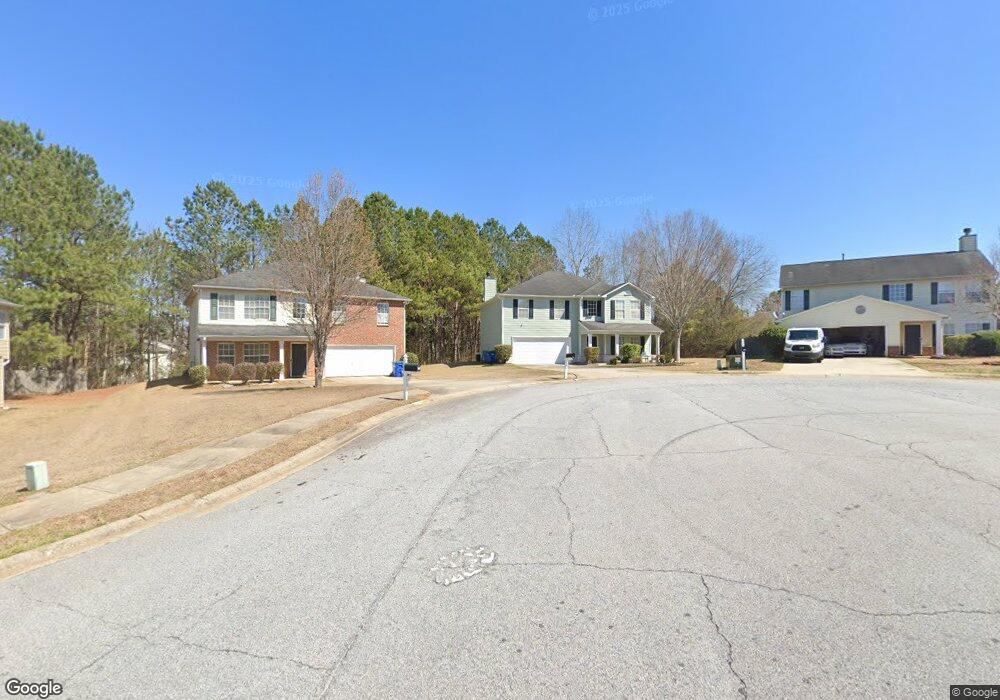
7423 Old Chapel Atlanta, GA 30349
Estimated Value: $298,000 - $355,637
4
Beds
4
Baths
2,516
Sq Ft
$126/Sq Ft
Est. Value
About This Home
This home is located at 7423 Old Chapel, Atlanta, GA 30349 and is currently estimated at $316,159, approximately $125 per square foot. 7423 Old Chapel is a home located in Fulton County with nearby schools including Cliftondale Elementary School, Renaissance Middle School, and Langston Hughes High School.
Ownership History
Date
Name
Owned For
Owner Type
Purchase Details
Closed on
Feb 11, 2009
Sold by
Hud & Housing Of Urban Dev
Bought by
Mixon Alesia
Current Estimated Value
Home Financials for this Owner
Home Financials are based on the most recent Mortgage that was taken out on this home.
Original Mortgage
$123,239
Outstanding Balance
$77,819
Interest Rate
5.08%
Mortgage Type
FHA
Estimated Equity
$238,340
Purchase Details
Closed on
Sep 2, 2008
Sold by
Citimortgage Inc
Bought by
Hud & Housing Of Urban Dev
Purchase Details
Closed on
May 7, 2008
Sold by
30349742307B Trust
Bought by
Sewell Andrea M
Purchase Details
Closed on
Apr 25, 2007
Sold by
Sewell Andrea M
Bought by
30349742307B Trust
Purchase Details
Closed on
Dec 5, 2003
Sold by
Centex Homes
Bought by
Sewell Cameron D
Home Financials for this Owner
Home Financials are based on the most recent Mortgage that was taken out on this home.
Original Mortgage
$152,300
Interest Rate
5.82%
Mortgage Type
VA
Create a Home Valuation Report for This Property
The Home Valuation Report is an in-depth analysis detailing your home's value as well as a comparison with similar homes in the area
Home Values in the Area
Average Home Value in this Area
Purchase History
| Date | Buyer | Sale Price | Title Company |
|---|---|---|---|
| Mixon Alesia | -- | -- | |
| Hud & Housing Of Urban Dev | -- | -- | |
| Citimortgage Inc | $190,511 | -- | |
| Sewell Andrea M | -- | -- | |
| Bray Ed | -- | -- | |
| 30349742307B Trust | -- | -- | |
| Sewell Cameron D | $158,000 | -- |
Source: Public Records
Mortgage History
| Date | Status | Borrower | Loan Amount |
|---|---|---|---|
| Open | Mixon Alesia | $123,239 | |
| Previous Owner | Sewell Cameron D | $152,300 |
Source: Public Records
Tax History Compared to Growth
Tax History
| Year | Tax Paid | Tax Assessment Tax Assessment Total Assessment is a certain percentage of the fair market value that is determined by local assessors to be the total taxable value of land and additions on the property. | Land | Improvement |
|---|---|---|---|---|
| 2025 | $1,666 | $126,560 | $27,520 | $99,040 |
| 2023 | $3,595 | $127,360 | $32,760 | $94,600 |
| 2022 | $1,548 | $94,320 | $22,160 | $72,160 |
| 2021 | $1,519 | $79,840 | $16,040 | $63,800 |
| 2020 | $1,523 | $78,840 | $16,240 | $62,600 |
| 2019 | $1,757 | $72,800 | $14,000 | $58,800 |
| 2018 | $1,733 | $60,840 | $8,200 | $52,640 |
| 2017 | $1,187 | $46,200 | $9,760 | $36,440 |
| 2016 | $1,185 | $46,200 | $9,760 | $36,440 |
| 2015 | $1,189 | $46,200 | $9,760 | $36,440 |
| 2014 | $727 | $34,600 | $7,160 | $27,440 |
Source: Public Records
Map
Nearby Homes
- 7427 Old Chapel
- 7419 Old Chapel Unit 1
- 520 Abercorn Ct
- 435 Pinevale Ct
- 7435 Old Chapel
- 7435 Old Chapel Unit 121
- 510 Abercorn Ct
- 7415 Old Chapel Unit 1
- 415 Pinevale Ct
- 7445 Old Chapel
- 0 Abercorn Ct Unit 7193782
- 0 Abercorn Ct Unit 7083269
- 0 Abercorn Ct
- 525 Abercorn Ct
- 7405 Old Chapel
- 425 Pinevale Ct
- 455 Pinevale Ct
- 7430 Old Chapel
- 2951 Stream View
- 2961 Stream View