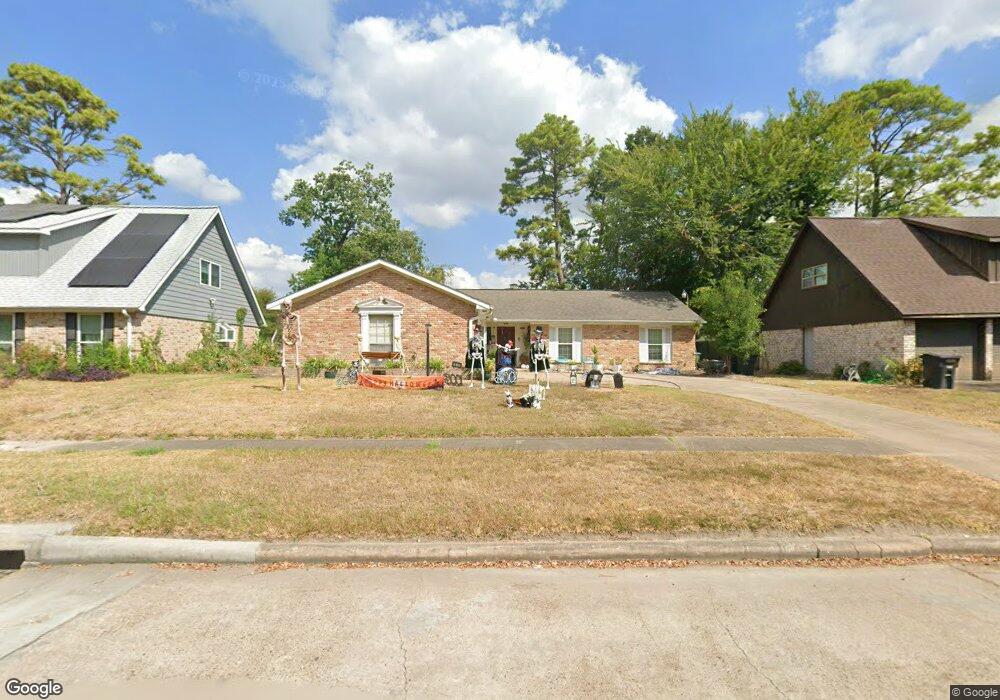
7423 Tall Pines Dr Houston, TX 77088
Greater Inwood NeighborhoodEstimated Value: $241,000 - $261,000
3
Beds
2
Baths
1,903
Sq Ft
$133/Sq Ft
Est. Value
About This Home
This home is located at 7423 Tall Pines Dr, Houston, TX 77088 and is currently estimated at $253,117, approximately $133 per square foot. 7423 Tall Pines Dr is a home located in Harris County with nearby schools including Edward a Vines EC/Pre-K/K School, J. Ruth Smith Elementary, and Hoffman Middle School.
Ownership History
Date
Name
Owned For
Owner Type
Purchase Details
Closed on
Oct 13, 2016
Sold by
Nesh I Llc
Bought by
Gipson John
Current Estimated Value
Home Financials for this Owner
Home Financials are based on the most recent Mortgage that was taken out on this home.
Original Mortgage
$152,950
Outstanding Balance
$122,618
Interest Rate
3.46%
Mortgage Type
New Conventional
Estimated Equity
$130,499
Purchase Details
Closed on
May 4, 2016
Sold by
Rose Pamela S
Bought by
Nesh I Llc
Purchase Details
Closed on
Jul 28, 2000
Sold by
Chavez Moises O
Bought by
Rose Pamela S
Home Financials for this Owner
Home Financials are based on the most recent Mortgage that was taken out on this home.
Original Mortgage
$78,350
Interest Rate
8.23%
Purchase Details
Closed on
Oct 1, 1999
Sold by
Garza Lezith Chavez
Bought by
Chavez Moises
Create a Home Valuation Report for This Property
The Home Valuation Report is an in-depth analysis detailing your home's value as well as a comparison with similar homes in the area
Home Values in the Area
Average Home Value in this Area
Purchase History
| Date | Buyer | Sale Price | Title Company |
|---|---|---|---|
| Gipson John | -- | Great American Title Co | |
| Nesh I Llc | -- | None Available | |
| Rose Pamela S | -- | First American Title | |
| Chavez Moises | -- | -- |
Source: Public Records
Mortgage History
| Date | Status | Borrower | Loan Amount |
|---|---|---|---|
| Open | Gipson John | $152,950 | |
| Previous Owner | Rose Pamela S | $78,350 | |
| Closed | Chavez Moises | $0 | |
| Closed | Rose Pamela S | $19,588 |
Source: Public Records
Tax History Compared to Growth
Tax History
| Year | Tax Paid | Tax Assessment Tax Assessment Total Assessment is a certain percentage of the fair market value that is determined by local assessors to be the total taxable value of land and additions on the property. | Land | Improvement |
|---|---|---|---|---|
| 2025 | $5,828 | $252,958 | $37,671 | $215,287 |
| 2024 | $5,828 | $256,818 | $37,671 | $219,147 |
| 2023 | $5,828 | $274,827 | $37,671 | $237,156 |
| 2022 | $6,519 | $271,794 | $34,246 | $237,548 |
| 2021 | $5,850 | $232,899 | $21,309 | $211,590 |
| 2020 | $5,404 | $204,733 | $21,309 | $183,424 |
| 2019 | $5,196 | $187,761 | $21,309 | $166,452 |
| 2018 | $2,491 | $173,472 | $21,309 | $152,163 |
| 2017 | $4,602 | $173,472 | $21,309 | $152,163 |
| 2016 | $3,027 | $122,652 | $21,309 | $101,343 |
| 2015 | $2,072 | $104,055 | $13,318 | $90,737 |
| 2014 | $2,072 | $94,304 | $13,318 | $80,986 |
Source: Public Records
Map
Nearby Homes
- 5907 Darkwood Dr
- 6918 Bent Branch Dr
- 6202 Wagonwheel Cir
- 7211 Deep Forest Dr
- 7606 Victory Dr
- 6931 Wagonwheel Ln
- 5906 Lawn Ln
- 7526 Antoine Dr
- 5914 Lawn Ln
- 0 Maple Hill Dr
- 7146 Bayou Forest Dr
- 4444 Victory Dr Unit 1311
- 4444 Victory Dr Unit 1108
- 6338 Maple Hill Dr
- 5710 Council Grove Ln
- 6310 Silver Chalice Dr
- 6311 Fairwood Dr
- 7218 Jadewood Dr Unit 770
- 7727 Green Lawn Dr
- 7219 Ridge Oak Dr
- 7427 Tall Pines Dr
- 7419 Tall Pines Dr
- 7431 Tall Pines Dr
- 7415 Tall Pines Dr
- 7422 Tall Pines Dr
- 7426 Tall Pines Dr
- 7411 Tall Pines Dr
- 7330 Tall Pines Dr
- 7430 Tall Pines Dr
- 7435 Tall Pines Dr
- 7326 Tall Pines Dr
- 7434 Tall Pines Dr
- 7407 Tall Pines Dr
- 7322 Tall Pines Dr
- 7438 Tall Pines Dr
- 7443 Tall Pines Dr
- 7318 Tall Pines Dr
- 7403 Tall Pines Dr
- 7442 Tall Pines Dr
- 7331 Tall Pines Dr