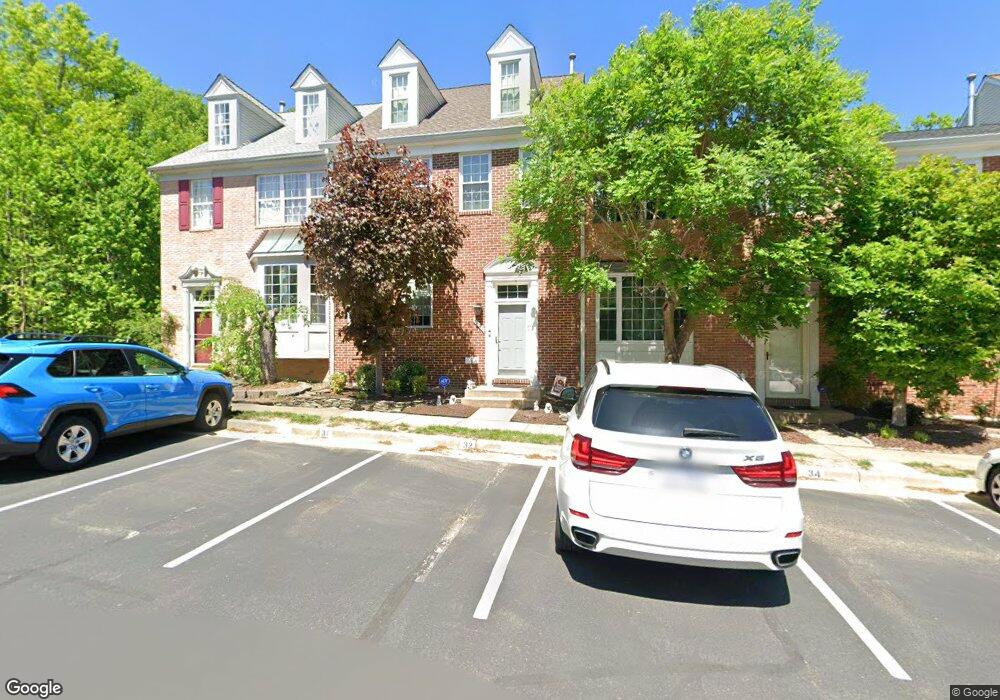
7425 Gillingham Row Alexandria, VA 22315
Estimated Value: $732,342 - $779,000
3
Beds
4
Baths
1,928
Sq Ft
$394/Sq Ft
Est. Value
About This Home
This home is located at 7425 Gillingham Row, Alexandria, VA 22315 and is currently estimated at $760,586, approximately $394 per square foot. 7425 Gillingham Row is a home located in Fairfax County with nearby schools including Lane Elementary School, Hayfield Secondary School, and Calvary Road Christian School & Preschool.
Ownership History
Date
Name
Owned For
Owner Type
Purchase Details
Closed on
Oct 1, 2015
Sold by
Rodney Marvin C and Rodney Sara M
Bought by
Marvin C Rodney Trust Dated October 1 20 and Sara M Rodney Trust Dated October 1 2015
Current Estimated Value
Purchase Details
Closed on
Jun 7, 2000
Sold by
Rhodes Brian J
Bought by
Rodney Marvin C
Home Financials for this Owner
Home Financials are based on the most recent Mortgage that was taken out on this home.
Original Mortgage
$194,000
Interest Rate
8.12%
Purchase Details
Closed on
Jul 18, 1994
Sold by
H C Kingstowne Lp
Bought by
Cooney Kristin A
Home Financials for this Owner
Home Financials are based on the most recent Mortgage that was taken out on this home.
Original Mortgage
$219,800
Interest Rate
8.51%
Create a Home Valuation Report for This Property
The Home Valuation Report is an in-depth analysis detailing your home's value as well as a comparison with similar homes in the area
Home Values in the Area
Average Home Value in this Area
Purchase History
| Date | Buyer | Sale Price | Title Company |
|---|---|---|---|
| Marvin C Rodney Trust Dated October 1 20 | -- | None Available | |
| Rodney Marvin C | $242,500 | -- | |
| Cooney Kristin A | $231,484 | -- |
Source: Public Records
Mortgage History
| Date | Status | Borrower | Loan Amount |
|---|---|---|---|
| Previous Owner | Rodney Marvin C | $194,000 | |
| Previous Owner | Cooney Kristin A | $219,800 |
Source: Public Records
Tax History Compared to Growth
Tax History
| Year | Tax Paid | Tax Assessment Tax Assessment Total Assessment is a certain percentage of the fair market value that is determined by local assessors to be the total taxable value of land and additions on the property. | Land | Improvement |
|---|---|---|---|---|
| 2025 | $8,067 | $721,890 | $240,000 | $481,890 |
| 2024 | $8,067 | $696,330 | $230,000 | $466,330 |
| 2023 | $7,565 | $670,340 | $220,000 | $450,340 |
| 2022 | $7,356 | $643,330 | $200,000 | $443,330 |
| 2021 | $6,847 | $583,470 | $165,000 | $418,470 |
| 2020 | $6,449 | $544,880 | $160,000 | $384,880 |
| 2019 | $6,252 | $528,300 | $157,000 | $371,300 |
| 2018 | $6,010 | $522,620 | $155,000 | $367,620 |
| 2017 | $5,975 | $514,650 | $155,000 | $359,650 |
| 2016 | $6,174 | $532,910 | $155,000 | $377,910 |
| 2015 | $5,736 | $513,970 | $155,000 | $358,970 |
| 2014 | $5,447 | $489,200 | $131,000 | $358,200 |
Source: Public Records
Map
Nearby Homes
- 7496 Gadsby Square
- 6211 Glenshire Row
- 7428 Heatherfield Ln
- 7312 Gene St
- 6152 Braeleigh Ln
- 7477 Collins Meade Way
- 6223 Walkers Croft Way
- 6125 Summer Park Ln
- 6253 Folly Ln
- 6235 Folly Ln
- 6237 Folly Ln
- 6998 Admetus Ct
- 6331 Steinway St
- 7508 Ashby Ln Unit K
- 6022B Curtier Dr Unit B
- 7010 Old Brentford Rd
- 6109 Wigmore Ln Unit A
- 6279 Alforth Ave
- 6006F Curtier Dr Unit F
- 7472 Cross Gate Ln
- 7427 Gillingham Row
- 7423 Gillingham Row
- 7429 Gillingham Row
- 7431 Gillingham Row
- 7433 Gillingham Row
- 7421 Gillingham Row
- 7419 Gillingham Row
- 7417 Gillingham Row
- 7415 Gillingham Row
- 7413 Gillingham Row
- 7437 Gillingham Row
- 7439 Gillingham Row
- 7441 Gillingham Row
- 7443 Gillingham Row
- 7411 Gillingham Row
- 7451 Gillingham Row
- 7453 Gillingham Row
- 7449 Gillingham Row
- 7455 Gillingham Row
- 7445 Gillingham Row