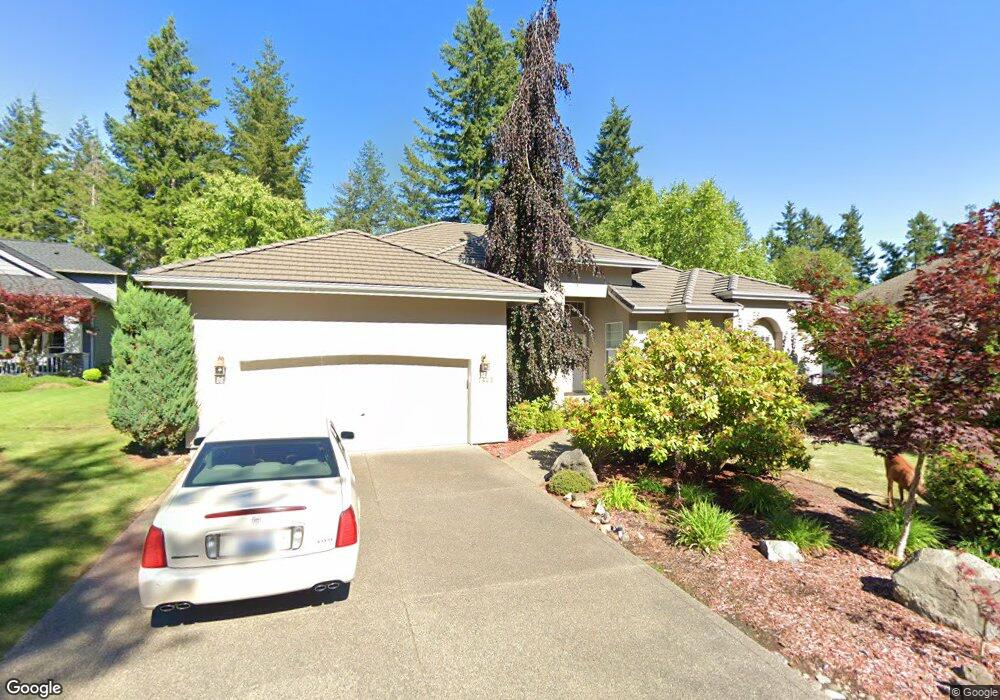
7425 Kells Ln SW Port Orchard, WA 98367
McCormick Woods NeighborhoodEstimated Value: $686,608 - $805,000
3
Beds
3
Baths
2,385
Sq Ft
$311/Sq Ft
Est. Value
About This Home
This home is located at 7425 Kells Ln SW, Port Orchard, WA 98367 and is currently estimated at $742,402, approximately $311 per square foot. 7425 Kells Ln SW is a home located in Kitsap County with nearby schools including Sunnyslope Elementary School, Cedar Heights Middle School, and South Kitsap High School.
Ownership History
Date
Name
Owned For
Owner Type
Purchase Details
Closed on
Nov 9, 2005
Sold by
Wright Dennis E and Wright Kathy R
Bought by
Yee Bruce and Yee Sandra
Current Estimated Value
Home Financials for this Owner
Home Financials are based on the most recent Mortgage that was taken out on this home.
Original Mortgage
$344,000
Outstanding Balance
$186,868
Interest Rate
5.9%
Mortgage Type
Purchase Money Mortgage
Estimated Equity
$555,534
Purchase Details
Closed on
Jan 2, 2002
Sold by
Beneficial Washington Inc
Bought by
Wright Dennis E and Wright Kathy R
Home Financials for this Owner
Home Financials are based on the most recent Mortgage that was taken out on this home.
Original Mortgage
$256,500
Interest Rate
7.01%
Purchase Details
Closed on
Aug 24, 2001
Sold by
Hofbauer Linda M
Bought by
Beneficial Washington Inc
Purchase Details
Closed on
Feb 22, 2000
Sold by
Yee Construction Corp
Bought by
Kang Linda
Create a Home Valuation Report for This Property
The Home Valuation Report is an in-depth analysis detailing your home's value as well as a comparison with similar homes in the area
Home Values in the Area
Average Home Value in this Area
Purchase History
| Date | Buyer | Sale Price | Title Company |
|---|---|---|---|
| Yee Bruce | $430,280 | Land Title Company | |
| Wright Dennis E | $270,000 | Land Title Company | |
| Beneficial Washington Inc | -- | First American Title Ins Co | |
| Kang Linda | $55,000 | -- |
Source: Public Records
Mortgage History
| Date | Status | Borrower | Loan Amount |
|---|---|---|---|
| Open | Yee Bruce | $344,000 | |
| Previous Owner | Wright Dennis E | $256,500 |
Source: Public Records
Tax History Compared to Growth
Tax History
| Year | Tax Paid | Tax Assessment Tax Assessment Total Assessment is a certain percentage of the fair market value that is determined by local assessors to be the total taxable value of land and additions on the property. | Land | Improvement |
|---|---|---|---|---|
| 2026 | $5,561 | $707,120 | $129,150 | $577,970 |
| 2025 | $5,561 | $637,360 | $129,150 | $508,210 |
| 2024 | $5,368 | $637,360 | $129,150 | $508,210 |
| 2023 | $4,994 | $593,480 | $129,150 | $464,330 |
| 2022 | $5,050 | $505,150 | $117,600 | $387,550 |
| 2021 | $4,969 | $471,160 | $109,200 | $361,960 |
| 2020 | $4,959 | $455,990 | $105,000 | $350,990 |
| 2019 | $566 | $411,670 | $101,940 | $309,730 |
| 2018 | $4,477 | $352,740 | $87,260 | $265,480 |
| 2017 | $3,864 | $352,740 | $87,260 | $265,480 |
| 2016 | $3,910 | $330,440 | $81,550 | $248,890 |
| 2015 | $3,590 | $308,320 | $81,550 | $226,770 |
| 2014 | -- | $302,790 | $81,550 | $221,240 |
| 2013 | -- | $335,460 | $92,670 | $242,790 |
Source: Public Records
Map
Nearby Homes
- 7139 SW Dunraven Ln
- 6559 Gleneagle Ave SW
- 6909 Wentworth Ave SW
- 6904 Wentworth Ave SW
- 6209 Marymere Rd SW
- Hopewell Plan at McCormick Trails
- Abbot Plan at McCormick Trails
- Arlington Plan at McCormick Trails
- Andrea Plan at McCormick Trails
- 4101 SW Muller Ln Unit 313
- 5871 Thornhill Ave SW Unit 297
- 5941 Thornhill Ave SW
- 5961 Thornhill Ave SW Unit 289
- 5941 Thornhill Ave SW Unit 291
- 5961 Thornhill Ave SW
- 4083 SW Rustler St
- 1123 SW Sedge St
- 3670 SW Perth Place
- 5970 Thornhill Ave SW
- 6001 Thornhill Ave SW
- 7419 Kells Ln SW
- 7437 Kells Ln SW
- 7418 Kells Ln SW
- 7443 Kells Ln SW
- 7412 Kells Ln SW
- 7407 Kells Ln SW
- 7156 SW Dunraven Ln
- 7439 McCormick Woods Dr SW
- 7162 SW Dunraven Ln
- 7433 McCormick Woods Dr SW
- 7168 SW Dunraven Ln
- 7406 Kells Ln SW
- 7461 Kells Ln SW
- 7455 Kells Ln SW
- 7445 McCormick Woods Dr SW
- 7401 Kells Ln SW
- 7150 SW Dunraven Ln
- 7132 SW Dunraven Ln