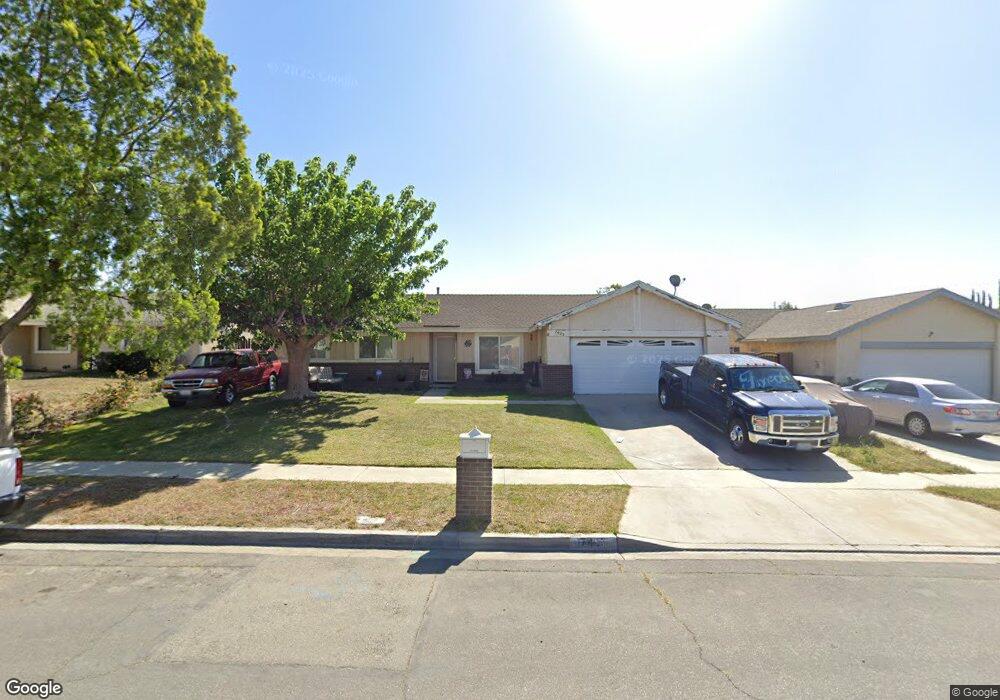
7425 Rosecrest Ave Fontana, CA 92336
Estimated Value: $545,786 - $644,000
3
Beds
2
Baths
1,317
Sq Ft
$453/Sq Ft
Est. Value
About This Home
This home is located at 7425 Rosecrest Ave, Fontana, CA 92336 and is currently estimated at $596,697, approximately $453 per square foot. 7425 Rosecrest Ave is a home located in San Bernardino County with nearby schools including Locust Elementary School, Alder Middle School, and Fontana A. B. Miller High School.
Ownership History
Date
Name
Owned For
Owner Type
Purchase Details
Closed on
Oct 20, 2005
Sold by
Snell Eric C and Snell Dodie J
Bought by
Snell Eric C and Snell Dodie J
Current Estimated Value
Home Financials for this Owner
Home Financials are based on the most recent Mortgage that was taken out on this home.
Original Mortgage
$162,850
Outstanding Balance
$86,725
Interest Rate
5.68%
Mortgage Type
New Conventional
Estimated Equity
$509,972
Purchase Details
Closed on
Nov 4, 2002
Sold by
Snell Eric C
Bought by
Snell Eric C and Snell Dodie J
Purchase Details
Closed on
Nov 24, 1997
Sold by
Peterson Irene S
Bought by
Snell Eric C
Home Financials for this Owner
Home Financials are based on the most recent Mortgage that was taken out on this home.
Original Mortgage
$86,949
Interest Rate
7.19%
Purchase Details
Closed on
Oct 16, 1996
Sold by
Peterson Raymond J and Peterson Irene S
Bought by
Peterson Irene S and Peterson Trust
Purchase Details
Closed on
Mar 8, 1995
Sold by
Leake Edwin L
Bought by
Peterson Raymond J and Peterson Irene S
Create a Home Valuation Report for This Property
The Home Valuation Report is an in-depth analysis detailing your home's value as well as a comparison with similar homes in the area
Purchase History
| Date | Buyer | Sale Price | Title Company |
|---|---|---|---|
| Snell Eric C | -- | Landsafe Rancho Cucamonga | |
| Snell Eric C | -- | -- | |
| Snell Eric C | $87,000 | Fidelity National Title Ins | |
| Peterson Irene S | -- | -- | |
| Peterson Raymond J | -- | Fidelity National Title Ins |
Source: Public Records
Mortgage History
| Date | Status | Borrower | Loan Amount |
|---|---|---|---|
| Open | Snell Eric C | $162,850 | |
| Closed | Snell Eric C | $86,949 |
Source: Public Records
Tax History
| Year | Tax Paid | Tax Assessment Tax Assessment Total Assessment is a certain percentage of the fair market value that is determined by local assessors to be the total taxable value of land and additions on the property. | Land | Improvement |
|---|---|---|---|---|
| 2025 | $2,487 | $138,915 | $34,808 | $104,107 |
| 2024 | $2,322 | $136,191 | $34,125 | $102,066 |
| 2023 | $1,819 | $133,521 | $33,456 | $100,065 |
| 2022 | $1,795 | $130,903 | $32,800 | $98,103 |
| 2021 | $1,770 | $128,336 | $32,157 | $96,179 |
| 2020 | $1,752 | $127,020 | $31,827 | $95,193 |
| 2019 | $1,710 | $124,529 | $31,203 | $93,326 |
| 2018 | $1,712 | $122,087 | $30,591 | $91,496 |
| 2017 | $1,678 | $119,693 | $29,991 | $89,702 |
| 2016 | $1,630 | $117,346 | $29,403 | $87,943 |
| 2015 | $1,593 | $115,583 | $28,961 | $86,622 |
| 2014 | $1,581 | $113,319 | $28,394 | $84,925 |
Source: Public Records
Map
Nearby Homes
- 7656 Evergreen Ln
- 7719 Alder Ave
- 7425 Palo Verde Ave
- 17465 Ramona Ave
- 18215 Grove Place
- 17548 Court St
- 17562 Court St
- 18281 Montgomery Ave
- 17432 Fairview Rd
- 17312 Miller Ave
- 17765 Barbee St
- 17273 Russo Ct
- 17640 Foothill Blvd
- 17190 Melon Ave
- 7590 Kempster Ct
- 7470 Ginger Dr
- 7127 Kempster Ave
- 18045 Foothill Blvd
- 17043 Sugar Hollow Ln
- 7887 Kempster Ave
- 7405 Rosecrest Ave
- 7435 Rosecrest Ave
- 17840 Shamrock Ave
- 17780 Shamrock Ave
- 7395 Rosecrest Ave
- 17845 Montgomery Ave
- 7400 Rosecrest Ave
- 17850 Shamrock Ave
- 7390 Rosecrest Ave
- 17855 Montgomery Ave
- 17825 Shamrock Ave
- 17770 Shamrock Ave
- 17785 Shamrock Ave
- 17835 Shamrock Ave
- 7380 Rosecrest Ave
- 17860 Shamrock Ave
- 17845 Shamrock Ave
- 17865 Montgomery Ave
- 7450 Palm Ln
- 17775 Shamrock Ave
Your Personal Tour Guide
Ask me questions while you tour the home.