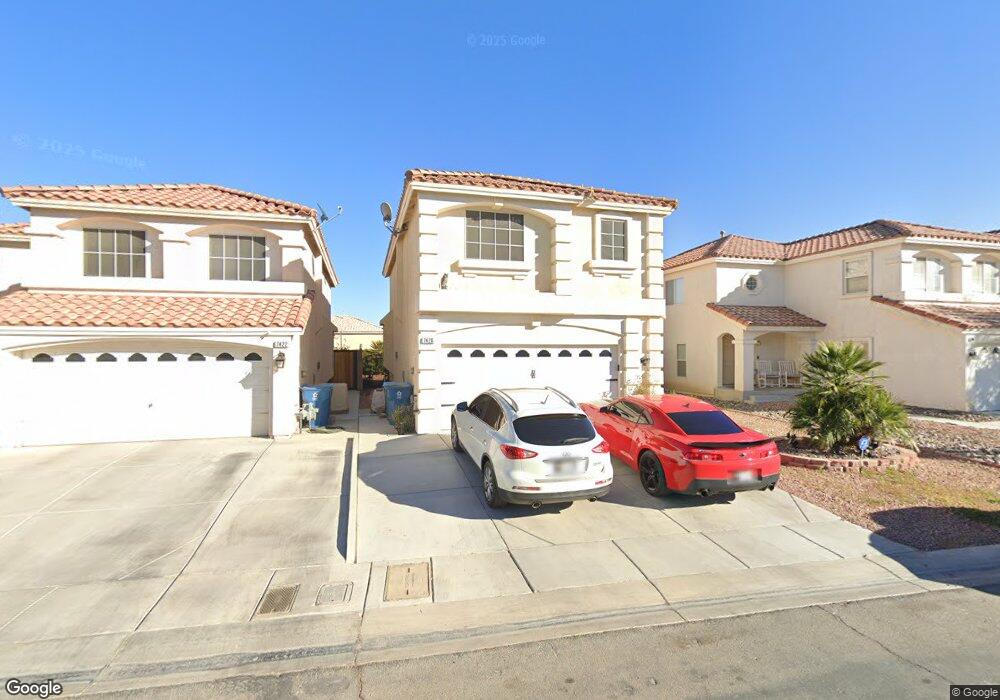
7426 Aurora Glow St Unit 2 Las Vegas, NV 89139
Coronado Ranch NeighborhoodEstimated Value: $408,000 - $420,000
3
Beds
3
Baths
1,656
Sq Ft
$250/Sq Ft
Est. Value
About This Home
This home is located at 7426 Aurora Glow St Unit 2, Las Vegas, NV 89139 and is currently estimated at $414,586, approximately $250 per square foot. 7426 Aurora Glow St Unit 2 is a home located in Clark County with nearby schools including Dr. Beverly S. Mathis Elementary School, Lawrence & Heidi Canarelli Middle School, and Desert Oasis High School.
Ownership History
Date
Name
Owned For
Owner Type
Purchase Details
Closed on
Feb 18, 2020
Sold by
Bailey Ginny L
Bought by
Guevara Rogelio M
Current Estimated Value
Home Financials for this Owner
Home Financials are based on the most recent Mortgage that was taken out on this home.
Original Mortgage
$272,964
Outstanding Balance
$241,782
Interest Rate
3.62%
Mortgage Type
FHA
Estimated Equity
$172,804
Purchase Details
Closed on
Oct 22, 2002
Sold by
American West Homes Inc
Bought by
Bailey Ginny L
Home Financials for this Owner
Home Financials are based on the most recent Mortgage that was taken out on this home.
Original Mortgage
$156,150
Interest Rate
5.95%
Create a Home Valuation Report for This Property
The Home Valuation Report is an in-depth analysis detailing your home's value as well as a comparison with similar homes in the area
Home Values in the Area
Average Home Value in this Area
Purchase History
| Date | Buyer | Sale Price | Title Company |
|---|---|---|---|
| Guevara Rogelio M | $278,000 | Lawyers Title Las Vegas | |
| Bailey Ginny L | $171,550 | First American Title Co |
Source: Public Records
Mortgage History
| Date | Status | Borrower | Loan Amount |
|---|---|---|---|
| Open | Guevara Rogelio M | $272,964 | |
| Previous Owner | Bailey Ginny L | $156,150 |
Source: Public Records
Tax History Compared to Growth
Tax History
| Year | Tax Paid | Tax Assessment Tax Assessment Total Assessment is a certain percentage of the fair market value that is determined by local assessors to be the total taxable value of land and additions on the property. | Land | Improvement |
|---|---|---|---|---|
| 2025 | $2,222 | $102,730 | $36,750 | $65,980 |
| 2024 | $2,058 | $102,730 | $36,750 | $65,980 |
| 2023 | $2,058 | $95,541 | $33,250 | $62,291 |
| 2022 | $1,906 | $85,598 | $28,700 | $56,898 |
| 2021 | $1,765 | $79,998 | $25,900 | $54,098 |
| 2020 | $1,636 | $77,079 | $23,450 | $53,629 |
| 2019 | $1,533 | $75,119 | $22,400 | $52,719 |
| 2018 | $1,463 | $67,580 | $17,150 | $50,430 |
| 2017 | $1,979 | $67,487 | $16,450 | $51,037 |
| 2016 | $1,370 | $63,165 | $12,250 | $50,915 |
| 2015 | $1,367 | $56,151 | $10,500 | $45,651 |
| 2014 | $1,327 | $43,889 | $6,300 | $37,589 |
Source: Public Records
Map
Nearby Homes
- 7468 Treasure Chest St
- 7478 Coastal Ledge St
- 5431 Hasley Canyon Ave
- 7569 Garden Galley St
- 5481 Railroad River Ave
- 7432 Decoro St
- 5419 Floating Flower Ave
- 7418 Granada Willows St
- 7438 Grizzly Giant St
- 7451 Grizzly Giant St
- 7463 Grizzly Giant St
- 7415 Innovation Peak Ct
- 7445 Innovation Peak Ct
- 7724 Somerhill Point Way
- 7446 Innovation Peak Ct
- 7766 Pacific Dunes St
- 5390 Montauck Ave
- 7658 Sandhaven St
- 7553 Rustic Galleon St
- 7813 Westwind Rd
- 7422 Aurora Glow St Unit 2
- 7434 Aurora Glow St Unit 2
- 7416 Aurora Glow St
- 7440 Aurora Glow St
- 7446 Aurora Glow St
- 7410 Aurora Glow St Unit n/a
- 7410 Aurora Glow St
- 5639 Vision Quest Ct
- 5639 Vision Quest Ct
- 5640 Anticipation Ct
- 7427 Aurora Glow St Unit n/a
- 7427 Aurora Glow St
- 7427 Aurora Glow St Unit none
- 7423 Aurora Glow St Unit 2
- 7435 Aurora Glow St
- 7452 Aurora Glow St
- 7417 Aurora Glow St Unit 2
- 7411 Aurora Glow St
- 5629 Vision Quest Ct
- 5630 Anticipation Ct