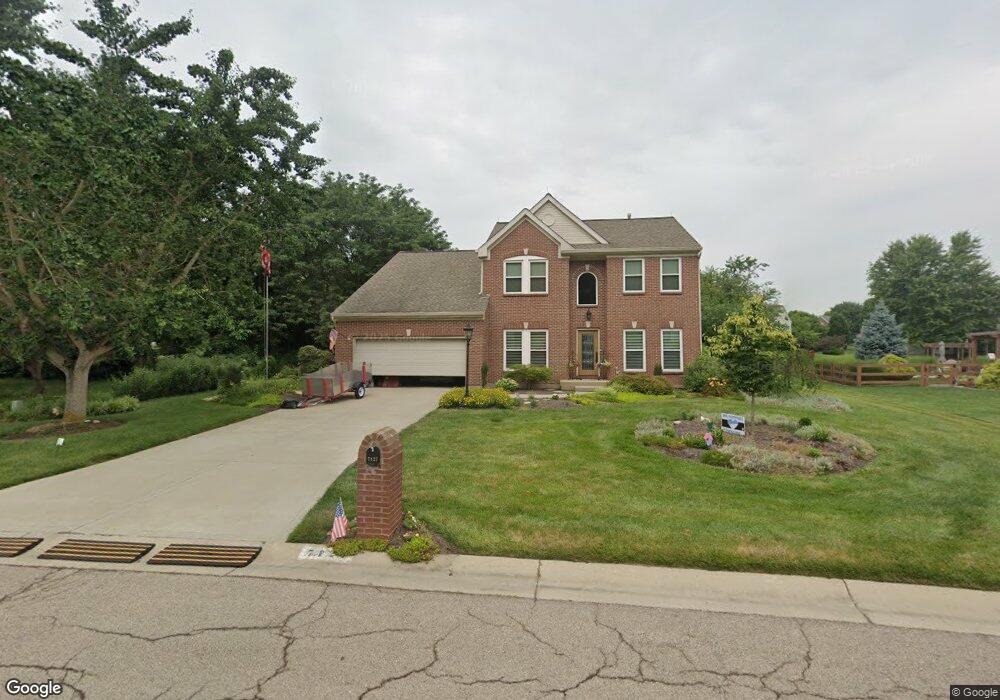
7427 Galway Ct West Chester, OH 45069
West Chester Township NeighborhoodEstimated Value: $485,000 - $510,000
4
Beds
3
Baths
2,616
Sq Ft
$189/Sq Ft
Est. Value
About This Home
This home is located at 7427 Galway Ct, West Chester, OH 45069 and is currently estimated at $493,658, approximately $188 per square foot. 7427 Galway Ct is a home located in Butler County with nearby schools including Union Elementary School, Hopewell Early Childhood School, and Hopewell Junior School.
Ownership History
Date
Name
Owned For
Owner Type
Purchase Details
Closed on
Jan 30, 2017
Sold by
Deltufo Kathleen J
Bought by
Kathleen J Deltufo and Peter A Deltufo
Current Estimated Value
Purchase Details
Closed on
Apr 23, 2004
Sold by
Deltufo Kathleen J and Blahnik Kathleen J
Bought by
Deltufo Kathleen J
Home Financials for this Owner
Home Financials are based on the most recent Mortgage that was taken out on this home.
Original Mortgage
$196,000
Interest Rate
5.63%
Mortgage Type
Stand Alone Refi Refinance Of Original Loan
Purchase Details
Closed on
Sep 10, 1996
Sold by
Williamsburg Properties
Bought by
Blahnik Gary A and Blahnik Kathleen
Home Financials for this Owner
Home Financials are based on the most recent Mortgage that was taken out on this home.
Original Mortgage
$142,300
Interest Rate
8.27%
Mortgage Type
New Conventional
Purchase Details
Closed on
Jun 21, 1996
Sold by
Cincinnati Land Dev Corp
Bought by
Williamsburg Properties Inc
Create a Home Valuation Report for This Property
The Home Valuation Report is an in-depth analysis detailing your home's value as well as a comparison with similar homes in the area
Home Values in the Area
Average Home Value in this Area
Purchase History
| Date | Buyer | Sale Price | Title Company |
|---|---|---|---|
| Kathleen J Deltufo | -- | -- | |
| Deltufo Kathleen J | -- | Premier Title Services Inc | |
| Blahnik Gary A | $178,115 | -- | |
| Williamsburg Properties Inc | $65,000 | -- |
Source: Public Records
Mortgage History
| Date | Status | Borrower | Loan Amount |
|---|---|---|---|
| Previous Owner | Deltufo Kathleen J | $196,000 | |
| Previous Owner | Blahnik Gary A | $142,300 |
Source: Public Records
Tax History Compared to Growth
Tax History
| Year | Tax Paid | Tax Assessment Tax Assessment Total Assessment is a certain percentage of the fair market value that is determined by local assessors to be the total taxable value of land and additions on the property. | Land | Improvement |
|---|---|---|---|---|
| 2024 | $5,431 | $131,600 | $17,830 | $113,770 |
| 2023 | $5,393 | $130,390 | $17,830 | $112,560 |
| 2022 | $5,016 | $90,070 | $17,830 | $72,240 |
| 2021 | $4,570 | $86,630 | $17,830 | $68,800 |
| 2020 | $4,678 | $86,630 | $17,830 | $68,800 |
| 2019 | $7,304 | $76,220 | $16,500 | $59,720 |
| 2018 | $4,317 | $76,220 | $16,500 | $59,720 |
| 2017 | $4,394 | $76,220 | $16,500 | $59,720 |
| 2016 | $4,331 | $70,750 | $16,500 | $54,250 |
| 2015 | $4,325 | $70,750 | $16,500 | $54,250 |
| 2014 | $4,342 | $70,750 | $16,500 | $54,250 |
| 2013 | $4,342 | $69,040 | $16,500 | $52,540 |
Source: Public Records
Map
Nearby Homes
- 7534 Galway Ct
- 7420 Kennesaw Dr
- 6038 Glennsbury Ct
- 5981 Birkdale Dr
- 7628 Lesourdsville West Chester Rd
- 7078 Lakota Ridge Dr
- 6570 Glen Arbor Dr
- 7724 W Lake Dr
- 7228 Shady Hollow Ln
- 6084 Tylersville Rd
- 7619 Brookstone Dr
- 6210 Cardington Place
- 6335 Dewberry Ct
- 6387 Coachlight Way
- 7886 Lesourdsville West Chester Rd
- 6168 Juneberry Ct
- 5716 E Senour Dr
- 7913 Merryman Way
- 7560 Shawnee Ln
- 5856 Ferdinand Dr
- 7407 Galway Ct
- 7447 Galway Ct
- 3462 Turnberry Ct
- 6237 Birkdale Dr
- 6243 Birkdale Dr
- 7387 Galway Ct
- 7410 Galway Ct
- 6229 Birkdale Dr
- 3452 Turnberry Ct
- 6255 Birkdale Dr
- 7454 Galway Ct
- 7487 Galway Ct
- 7390 Galway Ct
- 7472 Galway Ct
- 6221 Birkdale Dr
- 3461 Turnberry Ct
- 6292 Runabay Ct
- 7507 Galway Ct
- 6282 Runabay Ct
- 6232 Birkdale Dr