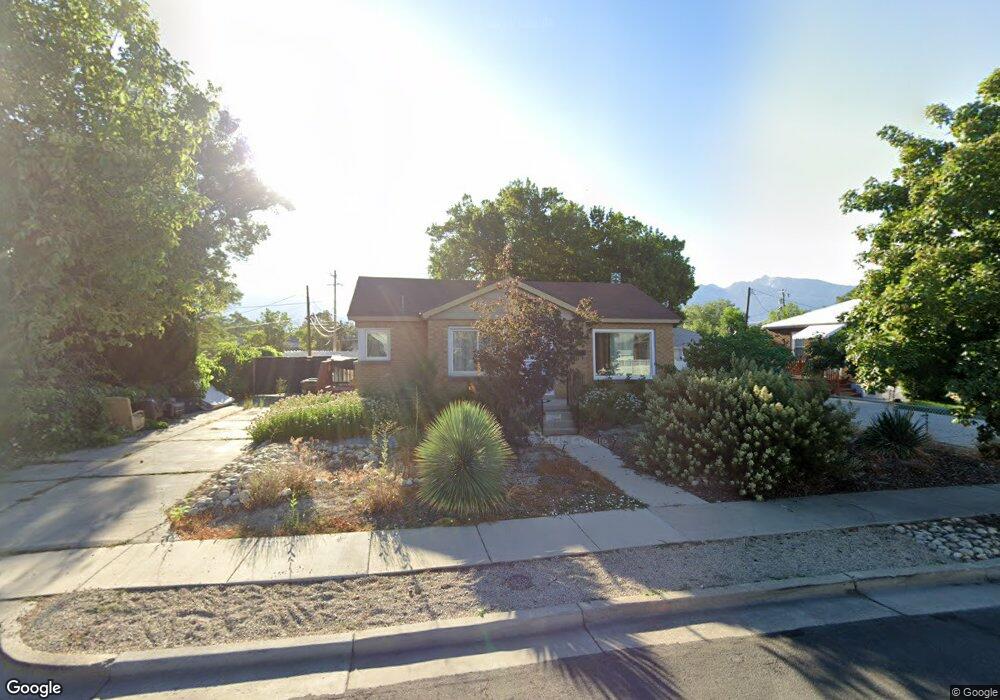
7427 S Elm St Midvale, UT 84047
Estimated Value: $409,000 - $464,000
3
Beds
2
Baths
1,878
Sq Ft
$233/Sq Ft
Est. Value
About This Home
This home is located at 7427 S Elm St, Midvale, UT 84047 and is currently estimated at $436,759, approximately $232 per square foot. 7427 S Elm St is a home located in Salt Lake County with nearby schools including East Midvale Elementary School, Midvale Middle School, and Hillcrest High School.
Ownership History
Date
Name
Owned For
Owner Type
Purchase Details
Closed on
Jul 9, 2019
Sold by
Bright Christopher R and Bright Cherise H
Bought by
Green Lisa
Current Estimated Value
Home Financials for this Owner
Home Financials are based on the most recent Mortgage that was taken out on this home.
Original Mortgage
$177,900
Outstanding Balance
$156,112
Interest Rate
3.9%
Mortgage Type
New Conventional
Estimated Equity
$280,647
Purchase Details
Closed on
Apr 1, 2010
Sold by
Pazell Andy G and Monroe Louise P
Bought by
Bright Christopher R and Bright Cherise H
Home Financials for this Owner
Home Financials are based on the most recent Mortgage that was taken out on this home.
Original Mortgage
$134,400
Interest Rate
4.95%
Mortgage Type
New Conventional
Purchase Details
Closed on
May 27, 2009
Sold by
Pazell Mello P
Bought by
Pazell Andy C and Monroe Louise P
Purchase Details
Closed on
Apr 16, 2009
Sold by
Pazell Magdalen P
Bought by
Pazell Andy G and Monroe Louise P
Create a Home Valuation Report for This Property
The Home Valuation Report is an in-depth analysis detailing your home's value as well as a comparison with similar homes in the area
Home Values in the Area
Average Home Value in this Area
Purchase History
| Date | Buyer | Sale Price | Title Company |
|---|---|---|---|
| Green Lisa | -- | Vanguard Title Ins Agcy | |
| Bright Christopher R | -- | Equity Title | |
| Pazell Andy C | -- | None Available | |
| Pazell Andy G | -- | None Available |
Source: Public Records
Mortgage History
| Date | Status | Borrower | Loan Amount |
|---|---|---|---|
| Open | Green Lisa | $177,900 | |
| Previous Owner | Bright Christopher R | $134,400 |
Source: Public Records
Tax History Compared to Growth
Tax History
| Year | Tax Paid | Tax Assessment Tax Assessment Total Assessment is a certain percentage of the fair market value that is determined by local assessors to be the total taxable value of land and additions on the property. | Land | Improvement |
|---|---|---|---|---|
| 2025 | $2,526 | $429,400 | $142,500 | $286,900 |
| 2024 | $2,526 | $430,900 | $135,400 | $295,500 |
| 2023 | $2,361 | $400,000 | $128,600 | $271,400 |
| 2022 | $2,469 | $408,300 | $126,100 | $282,200 |
| 2021 | $2,186 | $310,200 | $115,600 | $194,600 |
| 2020 | $2,076 | $279,100 | $84,100 | $195,000 |
| 2019 | $1,620 | $212,700 | $75,000 | $137,700 |
| 2018 | $1,553 | $206,800 | $75,000 | $131,800 |
| 2017 | $1,586 | $203,600 | $75,000 | $128,600 |
| 2016 | $1,470 | $183,300 | $75,000 | $108,300 |
| 2015 | $1,527 | $187,700 | $76,500 | $111,200 |
| 2014 | $1,498 | $180,000 | $74,300 | $105,700 |
Source: Public Records
Map
Nearby Homes
- 7427 Elm St
- 7373 S Wood Lily Ct Unit 24
- 7369 S Wood Lily Ct Unit 23
- 7370 S Wood Lily Ct Unit 26
- 7375 S Dewmar Ct Unit 36
- 7365 S Wood Lily Ct Unit 22
- 7366 S Wood Lily Ct Unit 27
- 7362 S Wood Lily Ct Unit 28
- 7361 S Wood Lily Ct Unit 21
- 7357 S Wood Lily Ct Unit 20
- 7358 S Wood Lily Ct Unit 29
- 7353 S Wood Lily Ct Unit 19
- 7354 S Wood Lily Ct Unit 30
- 7471 S Spruce St
- 7346 S Sideline Ln Unit 44
- 7342 S Sideline Ln Unit 45
- 7340 S Sideline Ln Unit 46
- 7338 S Sideline Ln Unit 47
- 7336 S Sideline Ln Unit 48
- 7333 S Seven Tree Ln Unit 83