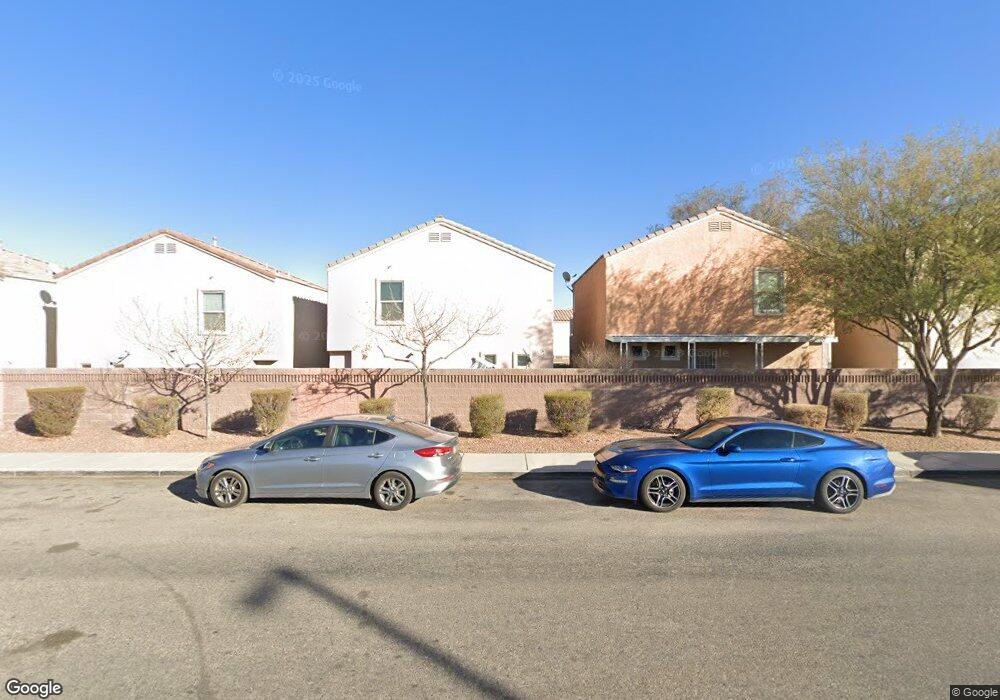
7429 Silurian St Las Vegas, NV 89139
Coronado Ranch NeighborhoodEstimated Value: $339,249 - $352,000
3
Beds
3
Baths
1,230
Sq Ft
$281/Sq Ft
Est. Value
About This Home
This home is located at 7429 Silurian St, Las Vegas, NV 89139 and is currently estimated at $345,312, approximately $280 per square foot. 7429 Silurian St is a home located in Clark County with nearby schools including Lawrence & Heidi Canarelli Middle School, Sierra Vista High School, and Doral Academy West Pebble.
Ownership History
Date
Name
Owned For
Owner Type
Purchase Details
Closed on
Jun 13, 2022
Sold by
Villegas Gomez Ruben
Bought by
Davis Kayla Yvonne and Sivori-Davis Andrew
Current Estimated Value
Home Financials for this Owner
Home Financials are based on the most recent Mortgage that was taken out on this home.
Original Mortgage
$348,570
Outstanding Balance
$332,651
Interest Rate
5.62%
Mortgage Type
FHA
Estimated Equity
$12,661
Purchase Details
Closed on
Apr 26, 2011
Sold by
Hallmarc Llc
Bought by
Gomez Ruben Villegas
Purchase Details
Closed on
Nov 17, 2010
Sold by
Luke Pauline
Bought by
Hallmarc Llc
Purchase Details
Closed on
Mar 25, 2005
Sold by
Astoria Bronco Llc
Bought by
Luke Pauline
Home Financials for this Owner
Home Financials are based on the most recent Mortgage that was taken out on this home.
Original Mortgage
$200,700
Interest Rate
5.62%
Mortgage Type
Unknown
Create a Home Valuation Report for This Property
The Home Valuation Report is an in-depth analysis detailing your home's value as well as a comparison with similar homes in the area
Home Values in the Area
Average Home Value in this Area
Purchase History
| Date | Buyer | Sale Price | Title Company |
|---|---|---|---|
| Davis Kayla Yvonne | $355,000 | Stewart Title | |
| Gomez Ruben Villegas | $89,000 | Ticor Title Las Vegas | |
| Hallmarc Llc | $82,500 | None Available | |
| Luke Pauline | $223,090 | First Amer Title Co Of Nv |
Source: Public Records
Mortgage History
| Date | Status | Borrower | Loan Amount |
|---|---|---|---|
| Open | Davis Kayla Yvonne | $348,570 | |
| Previous Owner | Luke Pauline | $200,700 |
Source: Public Records
Tax History Compared to Growth
Tax History
| Year | Tax Paid | Tax Assessment Tax Assessment Total Assessment is a certain percentage of the fair market value that is determined by local assessors to be the total taxable value of land and additions on the property. | Land | Improvement |
|---|---|---|---|---|
| 2025 | $1,359 | $83,304 | $28,000 | $55,304 |
| 2024 | $1,259 | $83,304 | $28,000 | $55,304 |
| 2023 | $1,259 | $77,446 | $25,550 | $51,896 |
| 2022 | $1,236 | $69,157 | $21,700 | $47,457 |
| 2021 | $1,079 | $65,377 | $20,300 | $45,077 |
| 2020 | $999 | $63,882 | $19,250 | $44,632 |
| 2019 | $937 | $60,301 | $16,450 | $43,851 |
| 2018 | $894 | $54,576 | $12,600 | $41,976 |
| 2017 | $1,584 | $53,830 | $11,550 | $42,280 |
| 2016 | $838 | $46,486 | $8,750 | $37,736 |
| 2015 | $835 | $42,514 | $6,650 | $35,864 |
| 2014 | $809 | $26,593 | $3,500 | $23,093 |
Source: Public Records
Map
Nearby Homes
- 6263 Oread Ave
- 6315 Anticline Ave Unit 1
- 7545 Slipstream St
- 6303 Scree Ct
- 6283 Lapilli Ave
- 7552 Wentworth Springs Ct
- 7553 Rustic Galleon St
- 7463 Grizzly Giant St
- 7451 Grizzly Giant St
- 7355 Lagoon Blue St
- 7293 Puffer Lake Ct
- 6378 Bright Nimbus Ave
- 7638 Hope Valley St
- 7243 Shannon Ridge Ct
- 6338 Sycamore Grove Ct
- 7252 Puffer Lake Ct
- 6111 Walker Valley Ct
- 7221 Atascadero Creek Ct
- 6538 Netherseal Ave
- 6191 Mythic Atlantis Ave
- 7435 Silurian St
- 7423 Silurian St
- 7417 Silurian St
- 7441 Silurian St
- 6315 Peneplain Ave
- 7411 Silurian St
- 6314 Peneplain Ave
- 6316 Oread Ave
- 6309 Peneplain Ave
- 6308 Peneplain Ave
- 6310 Oread Ave
- 6335 Oread Ave
- 6329 Oread Ave
- 6323 Oread Ave
- 6303 Peneplain Ave
- 6307 Pangea Ave
- 6317 Oread Ave
- 6304 Oread Ave
- 6302 Peneplain Ave
- 6311 Oread Ave