Estimated Value: $259,000 - $344,131
3
Beds
1
Bath
2,000
Sq Ft
$145/Sq Ft
Est. Value
About This Home
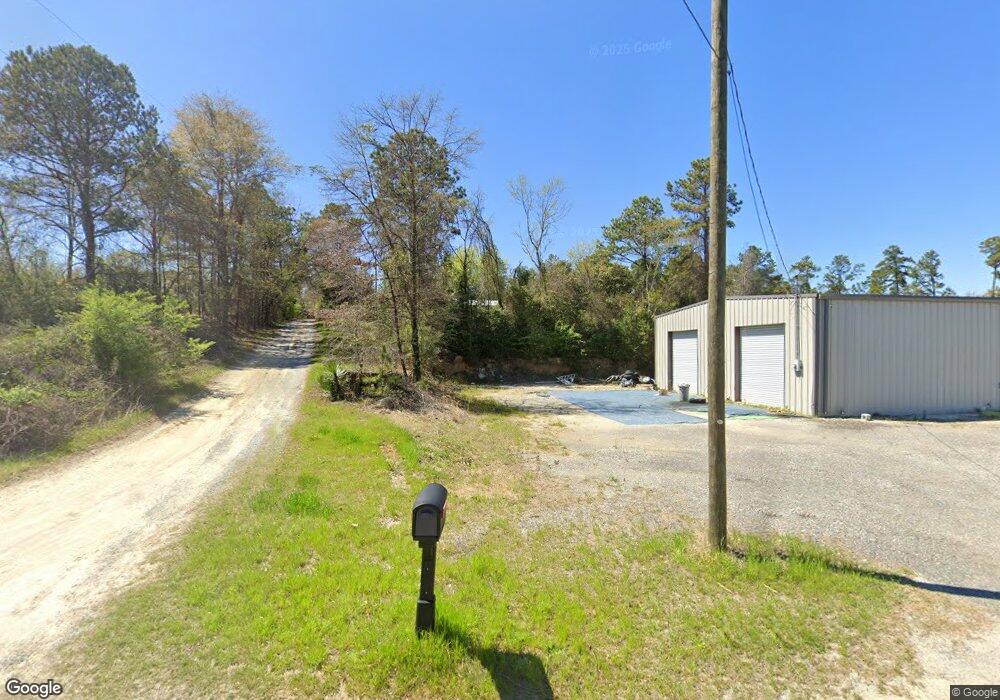
This home is located at 743 Chapman Rd, Byron, GA 31008 and is currently estimated at $290,044, approximately $145 per square foot. 743 Chapman Rd is a home located in Peach County with nearby schools including Byron Elementary School, Byron Middle School, and Peach County High School.
Ownership History
Date
Name
Owned For
Owner Type
Purchase Details
Closed on
May 14, 2024
Sold by
Radney Grant K
Bought by
Bloodworth Zackary D
Current Estimated Value
Purchase Details
Closed on
Apr 10, 2024
Sold by
Radney Grant K
Bought by
Bloodworth Zackary D
Purchase Details
Closed on
Oct 15, 2004
Sold by
Strong Gloria Gill
Bought by
Radney Grant K and Mcneil Sharon M
Purchase Details
Closed on
Dec 19, 1974
Bought by
Strong Gloria Gill
Create a Home Valuation Report for This Property
The Home Valuation Report is an in-depth analysis detailing your home's value as well as a comparison with similar homes in the area
Home Values in the Area
Average Home Value in this Area
Purchase History
| Date | Buyer | Sale Price | Title Company |
|---|---|---|---|
| Bloodworth Zackary D | $150,000 | -- | |
| Bloodworth Zackary D | $150,000 | -- | |
| Radney Grant K | $40,000 | -- | |
| Strong Gloria Gill | -- | -- |
Source: Public Records
Tax History Compared to Growth
Tax History
| Year | Tax Paid | Tax Assessment Tax Assessment Total Assessment is a certain percentage of the fair market value that is determined by local assessors to be the total taxable value of land and additions on the property. | Land | Improvement |
|---|---|---|---|---|
| 2024 | $3,807 | $135,000 | $77,320 | $57,680 |
| 2023 | $2,639 | $90,440 | $32,200 | $58,240 |
| 2022 | $2,030 | $67,840 | $32,200 | $35,640 |
| 2021 | $1,790 | $50,800 | $32,200 | $18,600 |
| 2020 | $1,794 | $50,920 | $32,200 | $18,720 |
| 2019 | $1,802 | $50,920 | $32,200 | $18,720 |
| 2018 | $1,810 | $50,920 | $32,200 | $18,720 |
| 2017 | $2,175 | $62,200 | $32,200 | $30,000 |
| 2016 | $1,716 | $47,920 | $32,200 | $15,720 |
| 2015 | $1,719 | $47,920 | $32,200 | $15,720 |
| 2014 | $1,721 | $47,920 | $32,200 | $15,720 |
| 2013 | -- | $47,920 | $32,200 | $15,720 |
Source: Public Records
Map
Nearby Homes
- 775 Chapman Rd
- 691 Chapman Rd
- 671 Chapman Rd
- 120 Evergreen Ct
- 105 Station Square Dr
- 109 Station Square Dr
- 111 Station Square Dr
- 110 Evergreen Ct
- 113 Station Square Dr
- 0 Evergreen Ct
- 115 Station Square Dr
- 101 Station Square Dr
- 130 Evergreen Ct
- 117 Station Square Dr
- 116 Station Square Dr
- 119 Station Square Dr
- 122 Timber Ridge Blvd
- 101 Cottage Cir
- 0 Station Square Dr Unit 7206791
- 0 Station Square Dr Unit 3129731