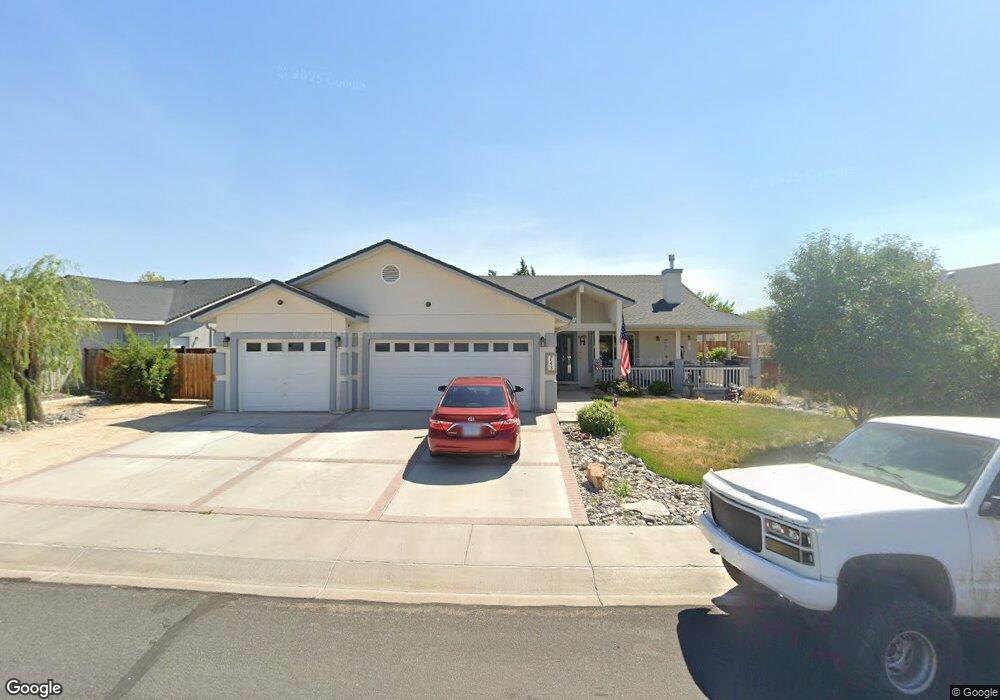
743 Divot Dr Fernley, NV 89408
Estimated Value: $447,819 - $468,000
3
Beds
2
Baths
2,041
Sq Ft
$224/Sq Ft
Est. Value
About This Home
This home is located at 743 Divot Dr, Fernley, NV 89408 and is currently estimated at $456,455, approximately $223 per square foot. 743 Divot Dr is a home located in Lyon County with nearby schools including East Valley Elementary School, Fernley Intermediate School, and Fernley High School.
Ownership History
Date
Name
Owned For
Owner Type
Purchase Details
Closed on
Dec 18, 2020
Sold by
Morgan Willie Ann
Bought by
Morgan Willie Ann and Morgan Wayne Monroe
Current Estimated Value
Create a Home Valuation Report for This Property
The Home Valuation Report is an in-depth analysis detailing your home's value as well as a comparison with similar homes in the area
Home Values in the Area
Average Home Value in this Area
Purchase History
| Date | Buyer | Sale Price | Title Company |
|---|---|---|---|
| Morgan Willie Ann | -- | None Listed On Document |
Source: Public Records
Tax History Compared to Growth
Tax History
| Year | Tax Paid | Tax Assessment Tax Assessment Total Assessment is a certain percentage of the fair market value that is determined by local assessors to be the total taxable value of land and additions on the property. | Land | Improvement |
|---|---|---|---|---|
| 2025 | $2,422 | $135,548 | $38,500 | $97,048 |
| 2024 | $2,760 | $136,033 | $38,500 | $97,532 |
| 2023 | $2,760 | $130,033 | $38,500 | $91,533 |
| 2022 | $2,591 | $122,241 | $38,500 | $83,741 |
| 2021 | $2,552 | $114,829 | $33,250 | $81,579 |
| 2020 | $2,485 | $111,993 | $33,250 | $78,743 |
| 2019 | $2,441 | $98,727 | $22,750 | $75,977 |
| 2018 | $2,385 | $91,629 | $17,500 | $74,129 |
| 2017 | $2,360 | $86,334 | $12,250 | $74,084 |
| 2016 | $2,156 | $75,497 | $4,380 | $71,117 |
| 2015 | $2,189 | $62,760 | $4,380 | $58,380 |
| 2014 | $2,137 | $49,661 | $4,380 | $45,281 |
Source: Public Records
Map
Nearby Homes
- 751 Divot Dr
- 763 Divot Dr
- 1063 Pepper Ln Unit 192
- 770 Divot Dr
- 1498 Slice Cir
- 103 Desert Lakes Dr
- 1129 Dixie Ln
- 231 Poppy Hills Dr
- 1103 Dixie Ln
- 151 Desert Springs Ln
- 239 Mary Lou Ln
- 165 Desert Springs Ln
- 231 Amber Ct
- 203 Mary Lou Ln
- 1610 Mary Ct
- 240 Mary Lou Ln
- 1304 Serenity Cir Unit LOT 24
- 288 Fallen Leaf Ln
- 1310 Serenity Cir Unit LOT 21
- 326 Bens Way