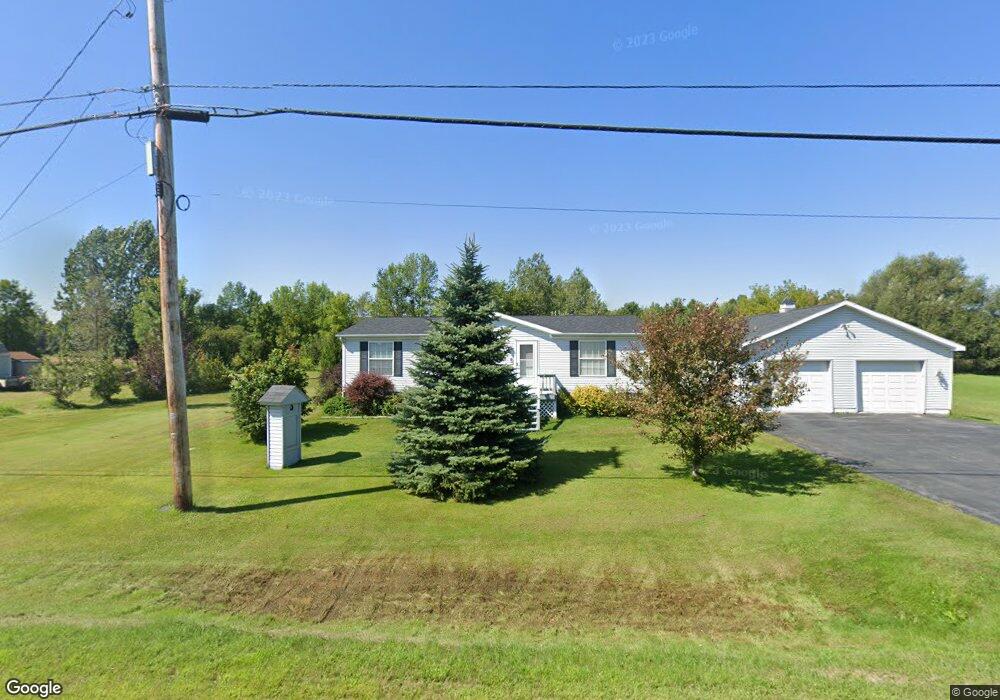
743 Durand Rd Plattsburgh, NY 12901
Estimated Value: $177,000 - $213,000
3
Beds
2
Baths
1,188
Sq Ft
$161/Sq Ft
Est. Value
About This Home
This home is located at 743 Durand Rd, Plattsburgh, NY 12901 and is currently estimated at $191,376, approximately $161 per square foot. 743 Durand Rd is a home located in Clinton County with nearby schools including Beekmantown Elementary School, Beekmantown Middle School, and Beekmantown High School.
Ownership History
Date
Name
Owned For
Owner Type
Purchase Details
Closed on
Jul 21, 2006
Sold by
Lts Homes Inc
Bought by
Gadway Dennis
Current Estimated Value
Purchase Details
Closed on
Apr 19, 2006
Sold by
Green Tree Credit Llc
Bought by
Lts Homes Inc
Purchase Details
Closed on
Apr 17, 2006
Sold by
Boyce Jefferson
Bought by
Green Tree Credit Llc
Purchase Details
Closed on
Jul 27, 2000
Sold by
Menard Gerald
Bought by
Boyce Jefferson J
Purchase Details
Closed on
Mar 22, 2000
Sold by
Menard Gerald
Bought by
Menard Gerald
Create a Home Valuation Report for This Property
The Home Valuation Report is an in-depth analysis detailing your home's value as well as a comparison with similar homes in the area
Home Values in the Area
Average Home Value in this Area
Purchase History
We collect this data history from publicly available records. To have your information removed, we recommend requesting removal directly through your county’s website.
| Date | Buyer | Sale Price | Title Company |
|---|---|---|---|
| Gadway Dennis | $84,900 | -- | |
| Lts Homes Inc | $50,000 | William Favreau | |
| Green Tree Credit Llc | $85,000 | Francis Smith | |
| Boyce Jefferson J | $10,000 | None | |
| Menard Gerald | -- | Michael Thompson |
Source: Public Records
Tax History
| Year | Tax Paid | Tax Assessment Tax Assessment Total Assessment is a certain percentage of the fair market value that is determined by local assessors to be the total taxable value of land and additions on the property. | Land | Improvement |
|---|---|---|---|---|
| 2025 | $987 | $177,700 | $34,200 | $143,500 |
| 2024 | $2,769 | $143,800 | $34,200 | $109,600 |
| 2023 | $2,844 | $143,800 | $34,200 | $109,600 |
| 2022 | $3,086 | $130,400 | $20,900 | $109,500 |
| 2021 | $2,910 | $116,100 | $18,500 | $97,600 |
| 2020 | $2,160 | $116,100 | $18,500 | $97,600 |
| 2019 | $1,727 | $108,000 | $17,600 | $90,400 |
| 2018 | $1,727 | $90,000 | $17,600 | $72,400 |
| 2017 | $1,716 | $90,000 | $17,600 | $72,400 |
| 2016 | $1,702 | $90,000 | $17,600 | $72,400 |
| 2015 | -- | $90,000 | $17,600 | $72,400 |
| 2014 | -- | $90,000 | $15,000 | $75,000 |
Source: Public Records
Map
Nearby Homes
- 2 Mansfield Dr
- 465 Spellman Rd
- 0.0 Stafford Rd
- 104 Wallace Hill Rd
- 402 Wallace Hill Rd
- 5 Crestview Dr
- 0 New York 374
- 182 Spellman Rd
- 31 Facteau Ave
- L11.4 Military Turnpike
- 000 Military Turnpike
- 4580 Military Turnpike
- L3 Military Turnpike
- 9 Melody Ln
- 10 Melody Ln
- 643 Ashley Rd
- 184 Tom Miller Rd
- 7147 U S 9
- 22 Tom Miller Rd
- 7459 U S 9
Your Personal Tour Guide
Ask me questions while you tour the home.