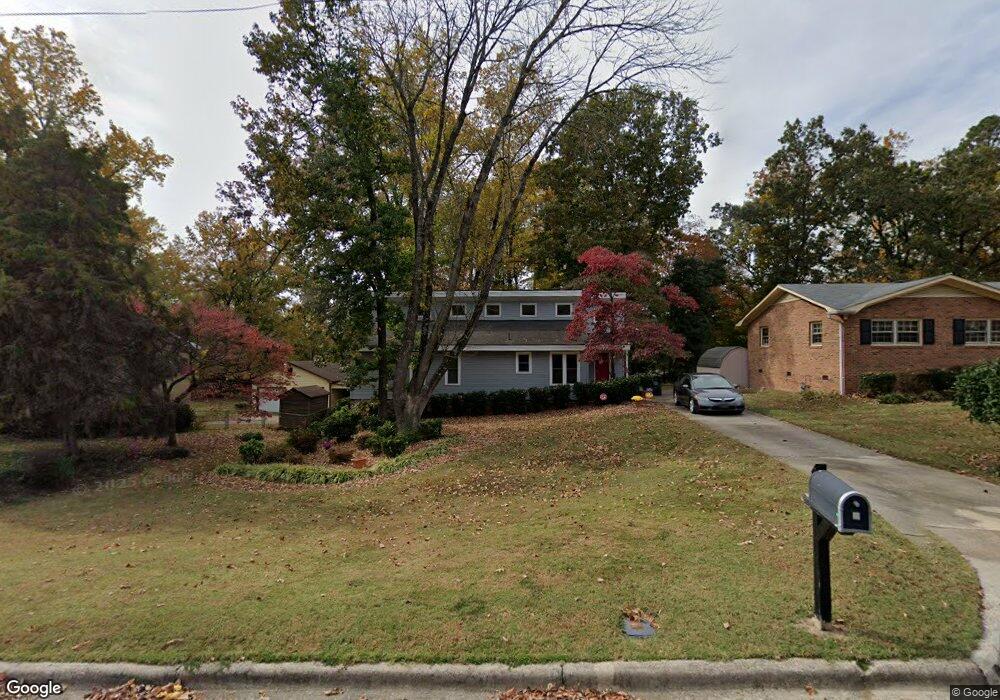
743 Gibson Dr NW Concord, NC 28025
Estimated Value: $259,000 - $314,000
2
Beds
3
Baths
1,548
Sq Ft
$180/Sq Ft
Est. Value
About This Home
This home is located at 743 Gibson Dr NW, Concord, NC 28025 and is currently estimated at $279,221, approximately $180 per square foot. 743 Gibson Dr NW is a home located in Cabarrus County with nearby schools including Beverly Hills STEM Elementary, Concord Middle School, and Concord High School.
Ownership History
Date
Name
Owned For
Owner Type
Purchase Details
Closed on
Mar 23, 2001
Sold by
Smith Michael D and Smith Suzanne N
Bought by
Morrissey Larry J and Morrissey Anita E
Current Estimated Value
Home Financials for this Owner
Home Financials are based on the most recent Mortgage that was taken out on this home.
Original Mortgage
$97,110
Outstanding Balance
$35,361
Interest Rate
7.02%
Estimated Equity
$243,861
Purchase Details
Closed on
Oct 17, 2000
Sold by
Seger Kurtis P and Seger Lisa C
Bought by
Smith Michael David and Smith Suzanne Nordan
Purchase Details
Closed on
Jun 19, 2000
Sold by
Smith Michael D and Nordan Suzanne M
Bought by
Smith Michael D and Smith Suzanne N
Home Financials for this Owner
Home Financials are based on the most recent Mortgage that was taken out on this home.
Original Mortgage
$85,500
Interest Rate
7.75%
Purchase Details
Closed on
May 1, 1996
Bought by
Smith Michael D
Purchase Details
Closed on
Aug 1, 1979
Create a Home Valuation Report for This Property
The Home Valuation Report is an in-depth analysis detailing your home's value as well as a comparison with similar homes in the area
Home Values in the Area
Average Home Value in this Area
Purchase History
| Date | Buyer | Sale Price | Title Company |
|---|---|---|---|
| Morrissey Larry J | $108,000 | -- | |
| Smith Michael David | $31,000 | -- | |
| Smith Michael D | -- | -- | |
| Smith Michael D | $82,000 | -- | |
| -- | $4,000 | -- |
Source: Public Records
Mortgage History
| Date | Status | Borrower | Loan Amount |
|---|---|---|---|
| Open | Morrissey Larry J | $97,110 | |
| Previous Owner | Smith Michael D | $85,500 |
Source: Public Records
Tax History Compared to Growth
Tax History
| Year | Tax Paid | Tax Assessment Tax Assessment Total Assessment is a certain percentage of the fair market value that is determined by local assessors to be the total taxable value of land and additions on the property. | Land | Improvement |
|---|---|---|---|---|
| 2025 | $2,293 | $230,190 | $58,000 | $172,190 |
| 2024 | $2,293 | $230,190 | $58,000 | $172,190 |
| 2023 | $1,844 | $151,170 | $26,000 | $125,170 |
| 2022 | $1,580 | $129,500 | $26,000 | $103,500 |
| 2021 | $1,580 | $129,500 | $26,000 | $103,500 |
| 2020 | $1,580 | $129,500 | $26,000 | $103,500 |
| 2019 | $1,265 | $103,650 | $16,000 | $87,650 |
| 2018 | $1,244 | $103,650 | $16,000 | $87,650 |
| 2017 | $1,223 | $103,650 | $16,000 | $87,650 |
| 2016 | $726 | $101,100 | $19,000 | $82,100 |
| 2015 | $1,193 | $101,100 | $19,000 | $82,100 |
| 2014 | $1,193 | $101,100 | $19,000 | $82,100 |
Source: Public Records
Map
Nearby Homes
- 152 Phifer Ave NW
- 636 Forest St NW
- 158 Spencer Ave NW
- 722 Wilmar St NW
- 584 Allison St NW
- 590 Harris St NW
- 101 Todd Dr NW
- 528 Gibson Dr NW
- 524 Railroad Dr NW
- 355 Camden Ct NW
- 19 Todd Dr NE
- 172 Brookwood Ave NW
- 604 Central Dr NW
- 80 Lecline Cir NE
- 921 Concord Parkway Hwy N
- 69 Lake Dr NW
- 383 Camden Ct NW
- 63 Brookwood Ave NW
- 480 Harris St NW
- 237 Palaside Dr NE
- 745 Gibson Dr NW
- 741 Gibson Dr NW
- 747 Gibson Dr NW
- 748 Harris St NW
- 746 Harris St NW
- 739 Gibson Dr NW
- 750 Harris St NW
- 740 Gibson Dr NW
- 735 Forest St NW
- 754 Harris St NW
- 737 Gibson Dr NW
- 749 Gibson Dr NW
- 719 Forest St NW
- 726 Harris St NW
- 760 Harris St NW
- 711 Forest St NW
- 735 Gibson Dr NW
- 747 Harris St NW
- 743 Harris St NW
- 703 Forest St NW