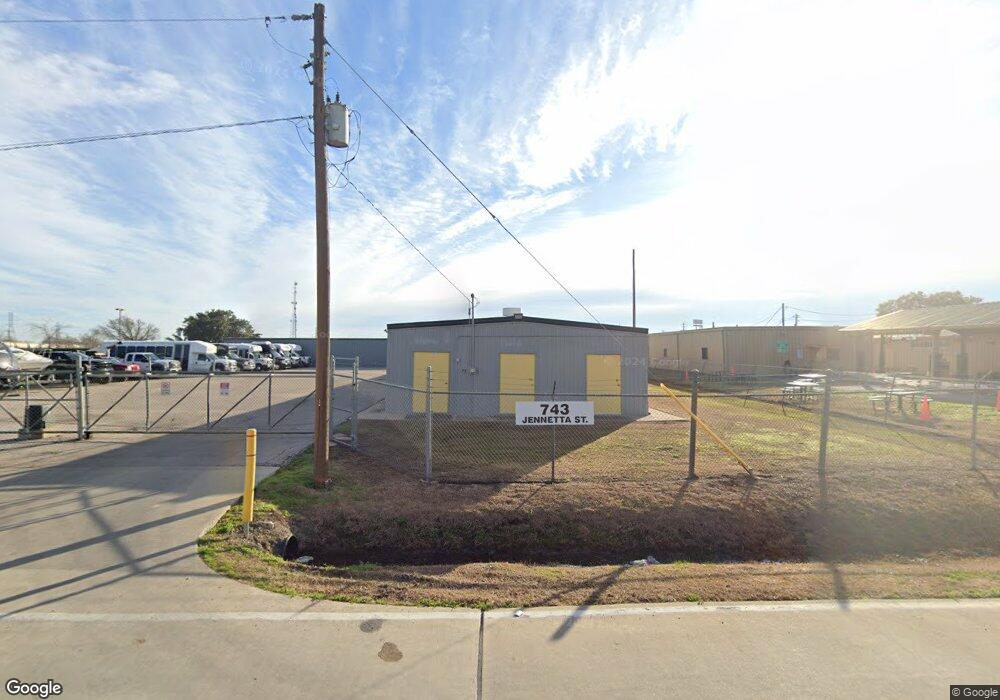
743 Jennetta St Rosenberg, TX 77471
--
Bed
--
Bath
4,200
Sq Ft
0.6
Acres
About This Home
This home is located at 743 Jennetta St, Rosenberg, TX 77471. 743 Jennetta St is a home located in Fort Bend County with nearby schools including Travis Elementary School, Henry Wertheimer Middle School, and Briscoe Junior High School.
Ownership History
Date
Name
Owned For
Owner Type
Purchase Details
Closed on
Aug 28, 2015
Sold by
Old West Properties Llc
Bought by
Diehl Inevestment Iv Lp
Purchase Details
Closed on
Jun 29, 2004
Sold by
Texroy Enterprises Inc
Bought by
Old West Properties Llc
Home Financials for this Owner
Home Financials are based on the most recent Mortgage that was taken out on this home.
Original Mortgage
$60,000
Interest Rate
6.31%
Mortgage Type
Commercial
Purchase Details
Closed on
Sep 30, 1997
Sold by
Nichols Joe C
Bought by
Texroy Enterprises Inc
Create a Home Valuation Report for This Property
The Home Valuation Report is an in-depth analysis detailing your home's value as well as a comparison with similar homes in the area
Home Values in the Area
Average Home Value in this Area
Purchase History
| Date | Buyer | Sale Price | Title Company |
|---|---|---|---|
| Diehl Inevestment Iv Lp | -- | Stewart Title | |
| Old West Properties Llc | -- | First American Title | |
| Diehl Investments Iv Lp | -- | -- | |
| Texroy Enterprises Inc | -- | -- |
Source: Public Records
Mortgage History
| Date | Status | Borrower | Loan Amount |
|---|---|---|---|
| Previous Owner | Diehl Investments Iv Lp | $60,000 |
Source: Public Records
Tax History Compared to Growth
Tax History
| Year | Tax Paid | Tax Assessment Tax Assessment Total Assessment is a certain percentage of the fair market value that is determined by local assessors to be the total taxable value of land and additions on the property. | Land | Improvement |
|---|---|---|---|---|
| 2025 | $3,992 | $221,130 | $82,328 | $138,802 |
| 2024 | $3,992 | $211,330 | $82,328 | $129,002 |
| 2023 | $4,175 | $216,266 | $82,328 | $133,938 |
| 2022 | $4,232 | $206,600 | $82,330 | $124,270 |
| 2021 | $1,991 | $95,964 | $49,400 | $46,564 |
| 2020 | $1,847 | $87,030 | $49,400 | $37,630 |
| 2019 | $1,980 | $86,680 | $49,400 | $37,280 |
| 2018 | $1,803 | $77,680 | $49,400 | $28,280 |
| 2017 | $1,706 | $73,090 | $49,400 | $23,690 |
| 2016 | $1,634 | $70,000 | $49,400 | $20,600 |
| 2015 | $2,922 | $124,560 | $49,400 | $75,160 |
| 2014 | $2,927 | $123,270 | $49,400 | $73,870 |
Source: Public Records
Map
Nearby Homes