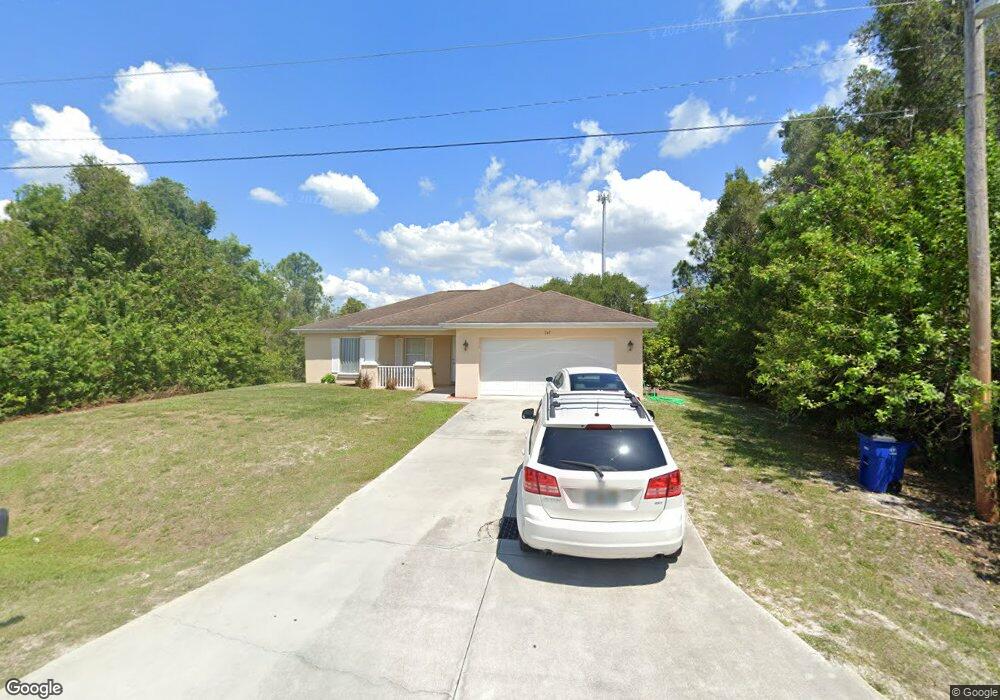
743 Kalamar Dr Lehigh Acres, FL 33974
Parkdale NeighborhoodEstimated Value: $275,831 - $312,000
3
Beds
2
Baths
1,618
Sq Ft
$179/Sq Ft
Est. Value
About This Home
This home is located at 743 Kalamar Dr, Lehigh Acres, FL 33974 and is currently estimated at $289,458, approximately $178 per square foot. 743 Kalamar Dr is a home located in Lee County with nearby schools including Lehigh Elementary School, Gateway Elementary School, and Tice Elementary School.
Ownership History
Date
Name
Owned For
Owner Type
Purchase Details
Closed on
Jun 3, 2022
Sold by
Nahcca Llc
Bought by
Chan Alice
Current Estimated Value
Purchase Details
Closed on
Jun 18, 2020
Sold by
Alice C Chan Revocable Living Trust
Bought by
Nahcca Llc
Purchase Details
Closed on
Apr 19, 2018
Sold by
Chan Alice C
Bought by
Chan Alice C and Alice C Chan Revocable Living Trust
Purchase Details
Closed on
Jun 25, 2014
Sold by
Gulf South Reo Llc
Bought by
Chan Alice C
Purchase Details
Closed on
May 9, 2014
Sold by
Wright Valarie L
Bought by
Gulf South Reo Llc
Purchase Details
Closed on
Oct 4, 2004
Sold by
First Home Builders Of Florida
Bought by
Wright Jonathan and Wright Valarie
Home Financials for this Owner
Home Financials are based on the most recent Mortgage that was taken out on this home.
Original Mortgage
$149,716
Interest Rate
5.75%
Mortgage Type
FHA
Create a Home Valuation Report for This Property
The Home Valuation Report is an in-depth analysis detailing your home's value as well as a comparison with similar homes in the area
Home Values in the Area
Average Home Value in this Area
Purchase History
| Date | Buyer | Sale Price | Title Company |
|---|---|---|---|
| Chan Alice | -- | None Listed On Document | |
| Nahcca Llc | -- | None Available | |
| Chan Alice C | -- | Attorney | |
| Chan Alice C | $98,000 | Attorney | |
| Gulf South Reo Llc | $72,600 | None Available | |
| Wright Jonathan | $150,900 | First Home Title Inc |
Source: Public Records
Mortgage History
| Date | Status | Borrower | Loan Amount |
|---|---|---|---|
| Previous Owner | Wright Jonathan | $149,716 |
Source: Public Records
Tax History Compared to Growth
Tax History
| Year | Tax Paid | Tax Assessment Tax Assessment Total Assessment is a certain percentage of the fair market value that is determined by local assessors to be the total taxable value of land and additions on the property. | Land | Improvement |
|---|---|---|---|---|
| 2025 | $3,533 | $204,638 | $19,009 | $185,079 |
| 2024 | $3,517 | $230,789 | $15,552 | $214,559 |
| 2023 | $3,517 | $233,565 | $13,932 | $219,633 |
| 2022 | $2,817 | $164,174 | $0 | $0 |
| 2021 | $2,449 | $149,249 | $6,000 | $143,249 |
| 2020 | $2,323 | $139,694 | $5,000 | $134,694 |
| 2019 | $2,227 | $126,784 | $4,700 | $122,084 |
| 2018 | $2,144 | $124,349 | $4,450 | $119,899 |
| 2017 | $2,045 | $118,706 | $4,210 | $114,496 |
| 2016 | $1,796 | $91,114 | $4,210 | $86,904 |
| 2015 | $1,685 | $83,301 | $3,660 | $79,641 |
| 2014 | $1,418 | $76,100 | $3,100 | $73,000 |
| 2013 | -- | $62,999 | $3,000 | $59,999 |
Source: Public Records
Map
Nearby Homes
- 810 Fabian Cir
- 735 La Plata Ave
- 806 Fabian Cir
- 808 Fabian Cir
- 804 Fabian Cir
- 728 La Plata Ave
- 803 Fabian Cir
- 722 La Plata Ave
- 741 Kalamar Dr
- 738 Kehosha Ave
- 719 Kehosha Ave
- 730 Kehosha Ave
- 13736 Golden Palms Cir
- 13743 Golden Palms Cir
- 726 Goldrock Rd
- 336 Parkdale Blvd
- 13779 Golden Palms Cir
- 737 Goldrock Rd
- 13666 Golden Palms Cir
- 423 La Perouse St
- 744 Kehosha Ave
- 743 Kehosha Ave
- 736 Kalamar Dr
- 740 Kehosha Ave
- 313 Eden Isle Place
- 733 Kalamar Dr
- 734 Kalamar Dr
- 733 Kari Cir
- 734 La Plata Ave
- 311 Eden Isle Place
- 805 El Castelay Ave
- 730 Kalamar Dr
- 309 Eden Isle Place
- 737 La Plata Ave
- 736 Kehosha Ave
- 729 Kalamar Dr
- 307 Eden Isle Place
- 730 La Plata Ave
- 736 Laramie Ave Unit 14
- 736 Laramie Ave