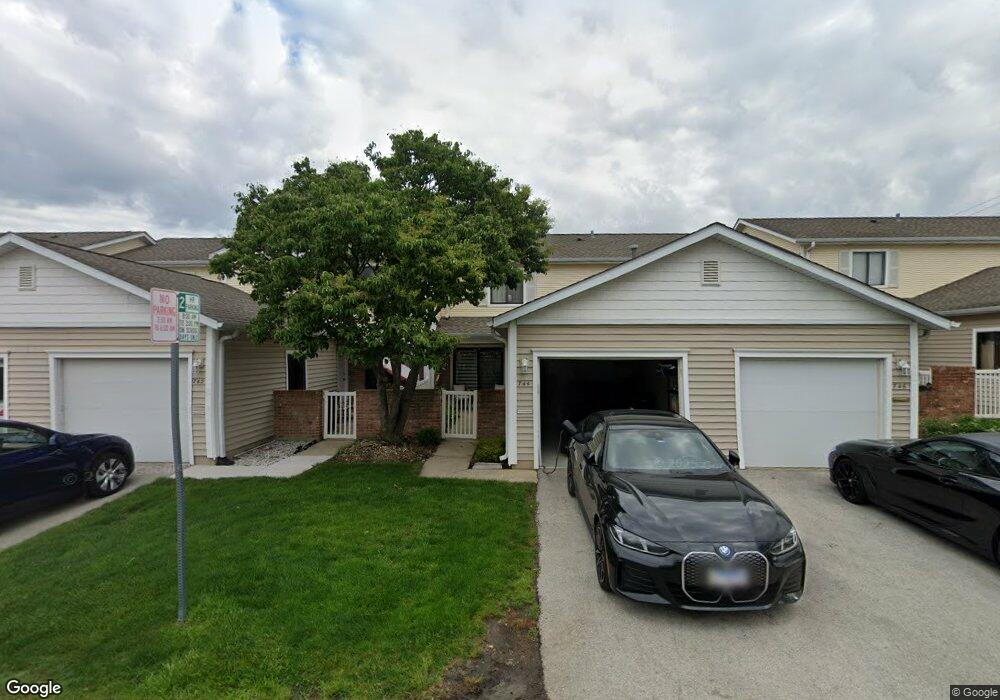
743 Lakeview Point Unit 743 Schaumburg, IL 60194
East Schaumburg NeighborhoodEstimated Value: $306,876 - $340,000
2
Beds
3
Baths
1,500
Sq Ft
$214/Sq Ft
Est. Value
About This Home
This home is located at 743 Lakeview Point Unit 743, Schaumburg, IL 60194 and is currently estimated at $320,969, approximately $213 per square foot. 743 Lakeview Point Unit 743 is a home located in Cook County with nearby schools including Everett Dirksen Elementary School, Robert Frost Junior High School, and J B Conant High School.
Ownership History
Date
Name
Owned For
Owner Type
Purchase Details
Closed on
Aug 9, 2023
Sold by
Patel Mr Kaunish
Bought by
Rupnish Llc
Current Estimated Value
Purchase Details
Closed on
May 9, 2017
Sold by
Parker Angelia H
Bought by
Patel Kaunish
Home Financials for this Owner
Home Financials are based on the most recent Mortgage that was taken out on this home.
Original Mortgage
$129,750
Interest Rate
3.77%
Mortgage Type
New Conventional
Purchase Details
Closed on
Nov 21, 1994
Sold by
Vandenberg Brian N and Vandenberg Kathleen J
Bought by
Parker Angelia H
Home Financials for this Owner
Home Financials are based on the most recent Mortgage that was taken out on this home.
Original Mortgage
$102,600
Interest Rate
9%
Create a Home Valuation Report for This Property
The Home Valuation Report is an in-depth analysis detailing your home's value as well as a comparison with similar homes in the area
Home Values in the Area
Average Home Value in this Area
Purchase History
| Date | Buyer | Sale Price | Title Company |
|---|---|---|---|
| Rupnish Llc | -- | None Listed On Document | |
| Patel Kaunish | $187,000 | Near North National Title | |
| Parker Angelia H | $108,000 | -- |
Source: Public Records
Mortgage History
| Date | Status | Borrower | Loan Amount |
|---|---|---|---|
| Previous Owner | Patel Kaunish | $129,750 | |
| Previous Owner | Parker Angelia H | $102,600 |
Source: Public Records
Tax History Compared to Growth
Tax History
| Year | Tax Paid | Tax Assessment Tax Assessment Total Assessment is a certain percentage of the fair market value that is determined by local assessors to be the total taxable value of land and additions on the property. | Land | Improvement |
|---|---|---|---|---|
| 2024 | $5,952 | $21,248 | $4,208 | $17,040 |
| 2023 | $5,772 | $21,248 | $4,208 | $17,040 |
| 2022 | $5,772 | $21,248 | $4,208 | $17,040 |
| 2021 | $4,907 | $16,191 | $5,391 | $10,800 |
| 2020 | $4,823 | $16,191 | $5,391 | $10,800 |
| 2019 | $4,824 | $17,999 | $5,391 | $12,608 |
| 2018 | $3,679 | $12,260 | $4,536 | $7,724 |
| 2017 | $3,621 | $12,260 | $4,536 | $7,724 |
| 2016 | $1,715 | $12,260 | $4,536 | $7,724 |
| 2015 | $1,951 | $11,045 | $3,945 | $7,100 |
| 2014 | $1,889 | $11,045 | $3,945 | $7,100 |
| 2013 | $1,885 | $11,045 | $3,945 | $7,100 |
Source: Public Records
Map
Nearby Homes
- 751 Edgelake Point Unit 68C
- 325 Bayview Point Unit 56B
- 601 Hanover Ct Unit Z2
- 600 Eastview Ct Unit X1
- 602 Eastview Ct Unit Z1
- 121 Chatsworth Cir
- 802 Stonewall Ct Unit 55
- 22 Ascot Cir
- 28 Ascot Cir
- 465 Apache Ln
- 15 Bar Harbour Rd Unit 4F
- 85 Marble Hill Ct Unit A1
- 223 Gareth Ln
- 350 Newgate Ct Unit 2Z
- 705 Ash Rd
- 91 Lambert Dr Unit B1
- 1257 Rosewood Ct Unit D1
- 1300 Woodside Ct Unit B1
- 845 Dracut Ln
- 151 Brookston Dr Unit A2
- 743 Lakeview Point Unit 102B
- 745 Lakeview Point Unit 101F
- 741 Lakeview Point Unit 102A
- 747 Lakeview Point Unit 101A
- 739 Lakeview Point Unit 103B
- 737 Lakeview Point Unit 103A
- 751 Lakeview Point Unit 100B
- 742 Lakeview Point Unit 97F
- 740 Lakeview Point Unit 97A
- 748 Lakeview Point Unit 99B
- 736 Lakeview Point Unit 96B
- 744 Lakeview Point Unit 98B
- 746 Lakeview Point Unit 98A
- 750 Lakeview Point Unit 99A
- 738 Lakeview Point Unit 96D
- 750 Whitesail Dr Unit 171C
- 750 Whitesail Dr Unit 750
- 747 Cove Point Unit 92D
- 747 Cove Point Unit 7
- 739 Cove Point Unit 94A