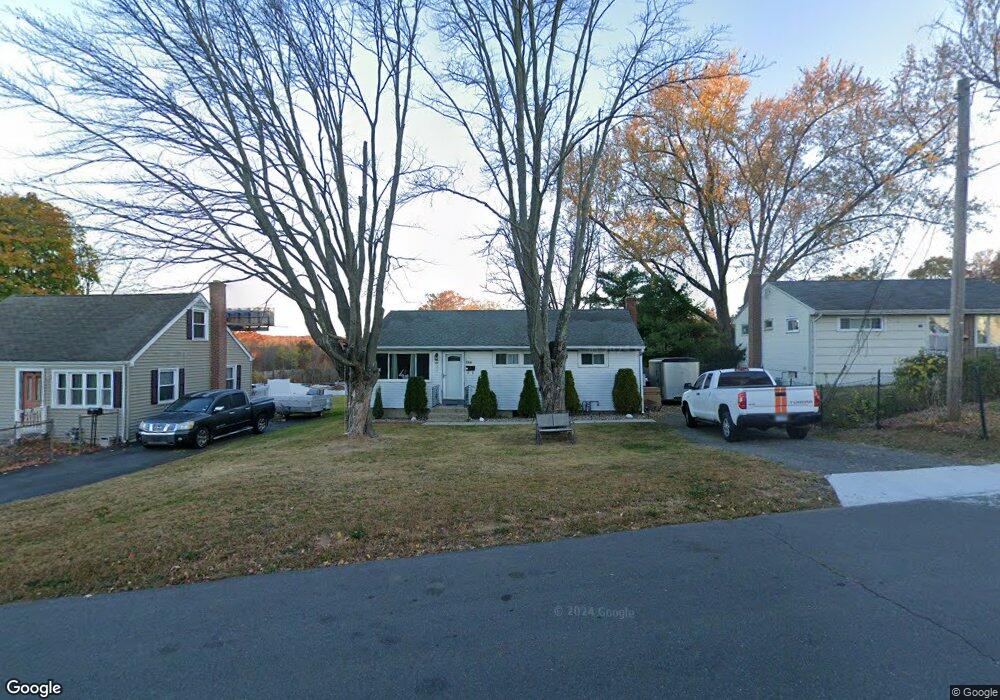
743 Osgood Ave New Britain, CT 06053
Estimated Value: $254,000 - $267,653
2
Beds
1
Bath
988
Sq Ft
$264/Sq Ft
Est. Value
About This Home
This home is located at 743 Osgood Ave, New Britain, CT 06053 and is currently estimated at $260,913, approximately $264 per square foot. 743 Osgood Ave is a home located in Hartford County with nearby schools including Gaffney School and Pulaski Middle School.
Ownership History
Date
Name
Owned For
Owner Type
Purchase Details
Closed on
Jun 27, 2023
Sold by
Jennings Michael J Est and Jennings
Bought by
Wright Valroy and Lajoie Jennifer
Current Estimated Value
Home Financials for this Owner
Home Financials are based on the most recent Mortgage that was taken out on this home.
Original Mortgage
$196,377
Outstanding Balance
$191,297
Interest Rate
6.35%
Mortgage Type
FHA
Estimated Equity
$69,616
Purchase Details
Closed on
Aug 7, 2006
Sold by
Reder Benjamin M
Bought by
Jennings Michael J
Home Financials for this Owner
Home Financials are based on the most recent Mortgage that was taken out on this home.
Original Mortgage
$118,800
Interest Rate
10.4%
Mortgage Type
Purchase Money Mortgage
Purchase Details
Closed on
Sep 29, 2005
Sold by
Kawecki Alice B
Bought by
Reder Benjamin M
Create a Home Valuation Report for This Property
The Home Valuation Report is an in-depth analysis detailing your home's value as well as a comparison with similar homes in the area
Home Values in the Area
Average Home Value in this Area
Purchase History
| Date | Buyer | Sale Price | Title Company |
|---|---|---|---|
| Wright Valroy | $200,000 | None Available | |
| Jennings Michael J | $148,500 | -- | |
| Reder Benjamin M | $80,000 | -- |
Source: Public Records
Mortgage History
| Date | Status | Borrower | Loan Amount |
|---|---|---|---|
| Open | Wright Valroy | $196,377 | |
| Previous Owner | Reder Benjamin M | $164,698 | |
| Previous Owner | Reder Benjamin M | $118,800 | |
| Previous Owner | Reder Benjamin M | $29,700 |
Source: Public Records
Tax History Compared to Growth
Tax History
| Year | Tax Paid | Tax Assessment Tax Assessment Total Assessment is a certain percentage of the fair market value that is determined by local assessors to be the total taxable value of land and additions on the property. | Land | Improvement |
|---|---|---|---|---|
| 2025 | $3,829 | $97,720 | $33,740 | $63,980 |
| 2024 | $3,869 | $97,720 | $33,740 | $63,980 |
| 2023 | $3,741 | $97,720 | $33,740 | $63,980 |
| 2022 | $3,340 | $67,480 | $14,210 | $53,270 |
| 2021 | $3,340 | $67,480 | $14,210 | $53,270 |
| 2020 | $3,408 | $67,480 | $14,210 | $53,270 |
| 2019 | $3,408 | $67,480 | $14,210 | $53,270 |
| 2018 | $3,408 | $67,480 | $14,210 | $53,270 |
| 2017 | $3,277 | $64,890 | $14,210 | $50,680 |
| 2016 | $3,277 | $64,890 | $14,210 | $50,680 |
| 2015 | $3,180 | $64,890 | $14,210 | $50,680 |
| 2014 | $3,180 | $64,890 | $14,210 | $50,680 |
Source: Public Records
Map
Nearby Homes
- 41 Skinner Dr
- 157 Skinner Dr
- 251 Pershing Ave
- 101 Maplehurst Ave
- 230 Hillhurst Ave
- 79 Hillhurst Ave
- 240 Hillhurst Ave
- 151 Sterling St
- 55 Horseplain Rd
- 148 Governor St
- 234 Pierremount Ave
- 97 Mckinley Dr
- 67 Eastwick Rd
- 133 Mckinley Dr
- 410 Farmington Ave Unit O6
- 410 Farmington Ave Unit H6
- 102 Mitchell St
- 42 Fairlane Dr
- 73 Beach St
- 65 Torkom Dr