
Seller's Agent in 2015
Gabriela Johnson
DICKERSON & NIEMAN
(815) 985-7486
5 in this area
126 Total Sales

Estimated Value: $313,000 - $410,000
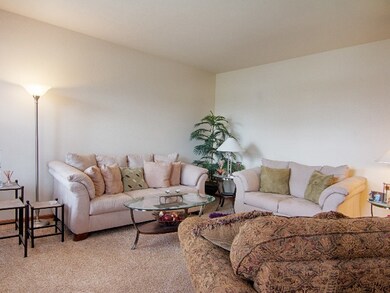
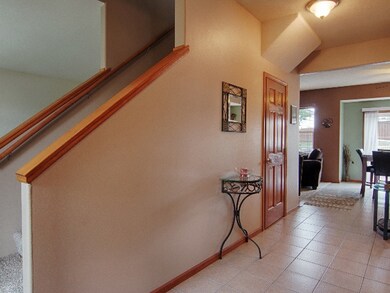
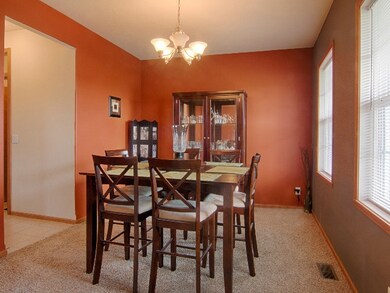
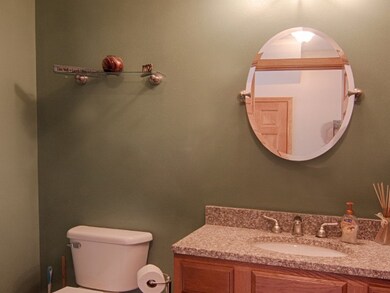
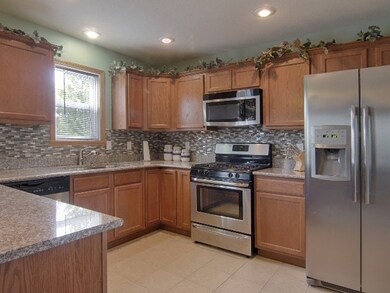
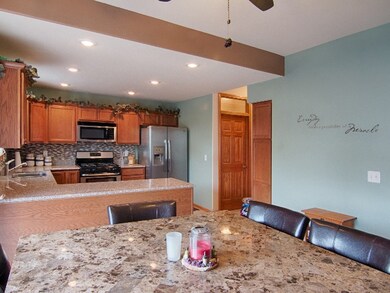
IMMACULATE 4 BEDROOM 2 STORY WITH COVERED FRONT PORCH IN CRYSTAL HILLS SUBDIVISION. TRADITIONAL FLOOR PLAN WITH FORMAL LIVING ROOM AND DINING ROOM. SPACIOUS KITCHEN WITH GRANITE COUNTERS, TILE BACKSPLASH OPENS TO EATING AREA AND FAMILY ROOM WITH GAS FIREPLACE. SLIDING GLASS DOORS TO GORGEOUS DECK, FENCED YARD AND 24' ROUND ABOVE GROUND POOL. SURROUNDED BY ADDITIONAL DECK. PATIO WITH FIREPIT AREA. ALL BEDROOMS UPSTAIRS, 2.5 BATH WITH GRANITE. EN-SUITE MASTER BATH WITH DOUBLE SINKS, WALK-IN CLOSET, WHIRLPOOL TUB. PROFESSIONAL LANDSCAPING IN-GROUND SPINKLERS, 3 CAR GARAGE. 6 PANEL DOORS WITH TRANSONS. FINISHED LOWER LEVEL WITH REC ROOM AND PLAY ROOM. COVETED SCHOOL DISTRICT. PRIDE OF OWNERSHIP!
Last Agent to Sell the Property
DICKERSON & NIEMAN License #475126959 Listed on: 07/28/2015
| Date | Buyer | Sale Price | Title Company |
|---|---|---|---|
| Flaningam Ronald | $200,000 | Mta |
| Date | Status | Borrower | Loan Amount |
|---|---|---|---|
| Open | Flaningam Ronald | $196,377 |
| Date | Event | Price | List to Sale | Price per Sq Ft |
|---|---|---|---|---|
| 09/14/2015 09/14/15 | Sold | $200,000 | 0.0% | $83 / Sq Ft |
| 08/03/2015 08/03/15 | Pending | -- | -- | -- |
| 07/28/2015 07/28/15 | For Sale | $200,000 | -- | $83 / Sq Ft |
| Year | Tax Paid | Tax Assessment Tax Assessment Total Assessment is a certain percentage of the fair market value that is determined by local assessors to be the total taxable value of land and additions on the property. | Land | Improvement |
|---|---|---|---|---|
| 2024 | $6,568 | $86,143 | $15,729 | $70,414 |
| 2022 | $6,047 | $70,671 | $12,904 | $57,767 |
| 2021 | $5,780 | $66,389 | $12,122 | $54,267 |
| 2020 | $5,676 | $63,977 | $11,682 | $52,295 |
| 2019 | $5,519 | $61,111 | $11,159 | $49,952 |
| 2018 | $5,245 | $58,721 | $10,723 | $47,998 |
| 2017 | $5,326 | $56,636 | $10,342 | $46,294 |
| 2016 | $5,141 | $55,728 | $10,176 | $45,552 |
| 2015 | $5,042 | $54,136 | $9,885 | $44,251 |
| 2014 | $4,767 | $53,452 | $9,760 | $43,692 |
Seller's Agent in 2015
Gabriela Johnson
DICKERSON & NIEMAN
(815) 985-7486
5 in this area
126 Total Sales
G
Buyer's Agent in 2015
Gary Blascoe
RE/MAX
(815) 988-3466
2 in this area
13 Total Sales
Source: NorthWest Illinois Alliance of REALTORS®
MLS Number: 201504801
APN: 08-06-254-015
Disclaimer: Certain information contained herein is derived from information provided by parties other than Homes.com. All information provided is deemed reliable, but is not guaranteed to be accurate and should be independently verified.
![]() IDX information is provided exclusively for personal, non-commercial use, and may not be used for any purpose other than to identify prospective properties consumers may be interested in purchasing. Information is deemed reliable but not guaranteed.
IDX information is provided exclusively for personal, non-commercial use, and may not be used for any purpose other than to identify prospective properties consumers may be interested in purchasing. Information is deemed reliable but not guaranteed.
Ask me questions while you tour the home.