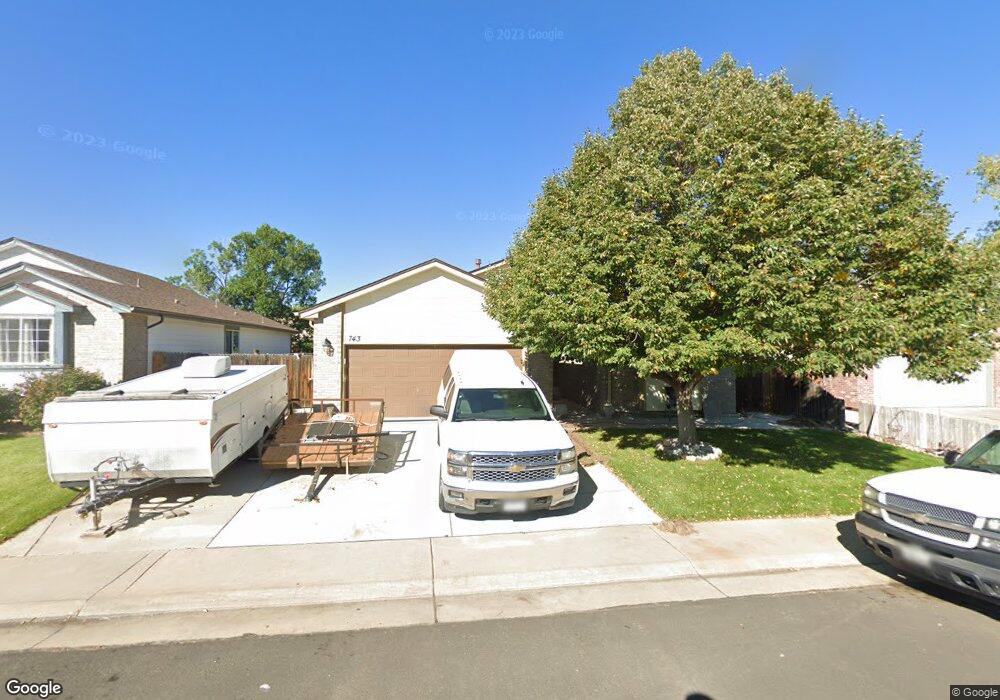
743 S 5th Ct Brighton, CO 80601
Estimated Value: $409,000 - $446,000
2
Beds
2
Baths
1,322
Sq Ft
$322/Sq Ft
Est. Value
About This Home
This home is located at 743 S 5th Ct, Brighton, CO 80601 and is currently estimated at $425,455, approximately $321 per square foot. 743 S 5th Ct is a home located in Adams County with nearby schools including South Elementary School, Vikan Middle School, and Brighton High School.
Ownership History
Date
Name
Owned For
Owner Type
Purchase Details
Closed on
Dec 7, 2009
Sold by
Solano Janette
Bought by
Solano Anthony
Current Estimated Value
Purchase Details
Closed on
Nov 24, 2009
Sold by
Solano Anthony and Solano Janette
Bought by
Solano Anthony
Purchase Details
Closed on
Jul 21, 2000
Sold by
Maverick Homes Llc
Bought by
Solano Anthony and Solano Janette
Home Financials for this Owner
Home Financials are based on the most recent Mortgage that was taken out on this home.
Original Mortgage
$148,211
Outstanding Balance
$49,724
Interest Rate
8.15%
Mortgage Type
FHA
Estimated Equity
$375,731
Purchase Details
Closed on
Jun 21, 1999
Sold by
Tk Property Investments Lllp
Bought by
Maverick Homes Llc
Home Financials for this Owner
Home Financials are based on the most recent Mortgage that was taken out on this home.
Original Mortgage
$111,900
Interest Rate
7.11%
Mortgage Type
Construction
Create a Home Valuation Report for This Property
The Home Valuation Report is an in-depth analysis detailing your home's value as well as a comparison with similar homes in the area
Home Values in the Area
Average Home Value in this Area
Purchase History
We collect this data history from publicly available records. To have your information removed, we recommend requesting removal directly through your county’s website.
| Date | Buyer | Sale Price | Title Company |
|---|---|---|---|
| Solano Anthony | -- | None Available | |
| Solano Anthony | -- | None Available | |
| Solano Anthony | $149,213 | -- | |
| Maverick Homes Llc | $38,000 | Land Title |
Source: Public Records
Mortgage History
We collect this data history from publicly available records. To have your information removed, we recommend requesting removal directly through your county’s website.
| Date | Status | Borrower | Loan Amount |
|---|---|---|---|
| Open | Solano Anthony | $148,211 | |
| Previous Owner | Maverick Homes Llc | $111,900 |
Source: Public Records
Tax History
| Year | Tax Paid | Tax Assessment Tax Assessment Total Assessment is a certain percentage of the fair market value that is determined by local assessors to be the total taxable value of land and additions on the property. | Land | Improvement |
|---|---|---|---|---|
| 2025 | $3,328 | $30,940 | $6,600 | $24,340 |
| 2024 | $3,328 | $28,440 | $6,060 | $22,380 |
| 2023 | $3,303 | $33,150 | $6,160 | $26,990 |
| 2022 | $2,718 | $24,160 | $6,320 | $17,840 |
| 2021 | $2,577 | $24,160 | $6,320 | $17,840 |
| 2020 | $2,549 | $24,970 | $6,510 | $18,460 |
| 2019 | $2,557 | $24,970 | $6,510 | $18,460 |
| 2018 | $2,014 | $19,520 | $5,760 | $13,760 |
| 2017 | $1,989 | $19,520 | $5,760 | $13,760 |
| 2016 | $1,581 | $15,400 | $3,660 | $11,740 |
| 2015 | $1,566 | $15,400 | $3,660 | $11,740 |
| 2014 | -- | $13,780 | $2,870 | $10,910 |
Source: Public Records
Map
Nearby Homes
Your Personal Tour Guide
Ask me questions while you tour the home.