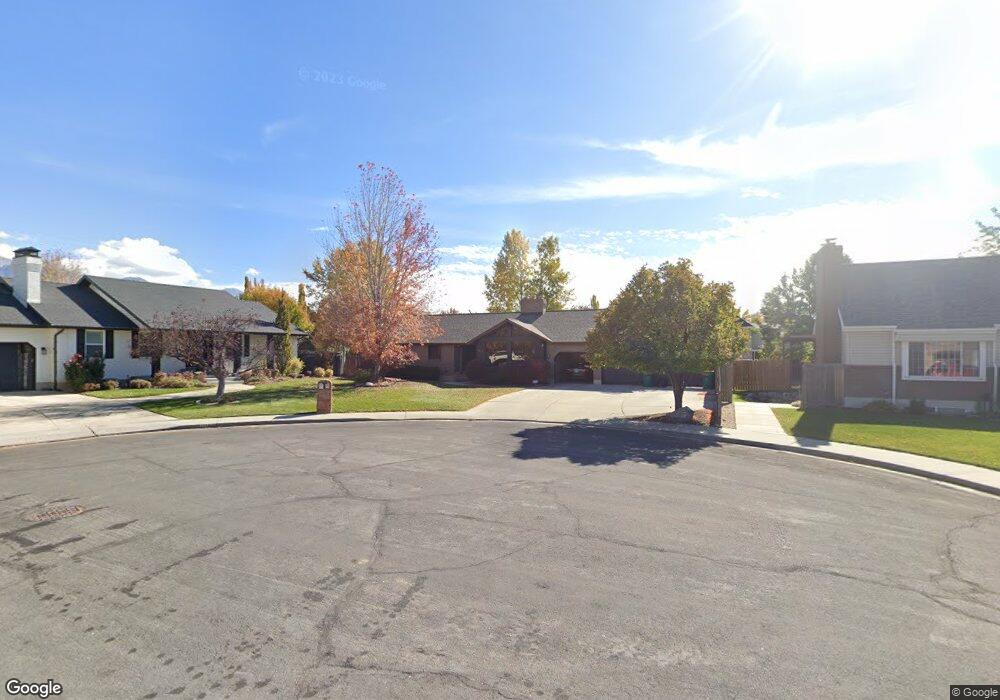
743 W 500 S Orem, UT 84058
Sunset Heights NeighborhoodEstimated Value: $587,000 - $673,000
5
Beds
3
Baths
2,690
Sq Ft
$235/Sq Ft
Est. Value
About This Home
This home is located at 743 W 500 S, Orem, UT 84058 and is currently estimated at $631,782, approximately $234 per square foot. 743 W 500 S is a home located in Utah County with nearby schools including Orem Elementary School, Lakeridge Jr High School, and Mountain View High School.
Ownership History
Date
Name
Owned For
Owner Type
Purchase Details
Closed on
Dec 7, 2017
Sold by
Street William and Street Mary
Bought by
Rhyndress Mervin W and Rhyndress Angela S
Current Estimated Value
Home Financials for this Owner
Home Financials are based on the most recent Mortgage that was taken out on this home.
Original Mortgage
$370,405
Outstanding Balance
$311,849
Interest Rate
3.94%
Mortgage Type
New Conventional
Estimated Equity
$319,933
Purchase Details
Closed on
Nov 4, 2015
Sold by
Street William
Bought by
Strret William and Strret Mary
Purchase Details
Closed on
Oct 16, 1998
Sold by
Street William and Street Mary W
Bought by
Street William
Home Financials for this Owner
Home Financials are based on the most recent Mortgage that was taken out on this home.
Original Mortgage
$138,500
Interest Rate
6.71%
Create a Home Valuation Report for This Property
The Home Valuation Report is an in-depth analysis detailing your home's value as well as a comparison with similar homes in the area
Home Values in the Area
Average Home Value in this Area
Purchase History
| Date | Buyer | Sale Price | Title Company |
|---|---|---|---|
| Rhyndress Mervin W | -- | Inwest Title | |
| Street William | -- | Inwest Title | |
| Strret William | -- | None Available | |
| Street William | -- | -- |
Source: Public Records
Mortgage History
| Date | Status | Borrower | Loan Amount |
|---|---|---|---|
| Open | Rhyndress Mervin W | $370,405 | |
| Previous Owner | Street William | $138,500 |
Source: Public Records
Tax History Compared to Growth
Tax History
| Year | Tax Paid | Tax Assessment Tax Assessment Total Assessment is a certain percentage of the fair market value that is determined by local assessors to be the total taxable value of land and additions on the property. | Land | Improvement |
|---|---|---|---|---|
| 2025 | $2,398 | $316,800 | $237,600 | $338,400 |
| 2024 | $2,398 | $293,260 | $0 | $0 |
| 2023 | $2,233 | $293,480 | $0 | $0 |
| 2022 | $2,415 | $307,450 | $0 | $0 |
| 2021 | $2,249 | $433,800 | $185,600 | $248,200 |
| 2020 | $2,067 | $391,800 | $148,500 | $243,300 |
| 2019 | $1,930 | $380,400 | $137,100 | $243,300 |
| 2018 | $1,919 | $361,300 | $118,000 | $243,300 |
| 2017 | $1,508 | $152,130 | $0 | $0 |
| 2016 | $1,603 | $149,160 | $0 | $0 |
| 2015 | $1,624 | $142,835 | $0 | $0 |
| 2014 | -- | $141,130 | $0 | $0 |
Source: Public Records
Map
Nearby Homes
- 740 W 580 S
- 520 S 800 W Unit 14
- 506 S 800 West St Unit 13
- 656 W 550 S
- 570 S 800 West St Unit 15
- 725 W 630 S
- 560 S 880 West St Unit 1
- 410 S 600 W
- 572 S 880 W
- 849 W 225 S
- 492 S 400 W
- 272 S Ridgecrest Dr
- 397 W 400 S
- 1069 W 680 S
- 881 S 635 W
- 988 W 170 S
- 1194 W 400 S
- 279 W 630 S
- 896 W 30 S
- 155 S 1200 W Unit 6